StatsTest Blog
Experimental design, data analysis, and statistical tooling for modern teams. No hype, just the math.
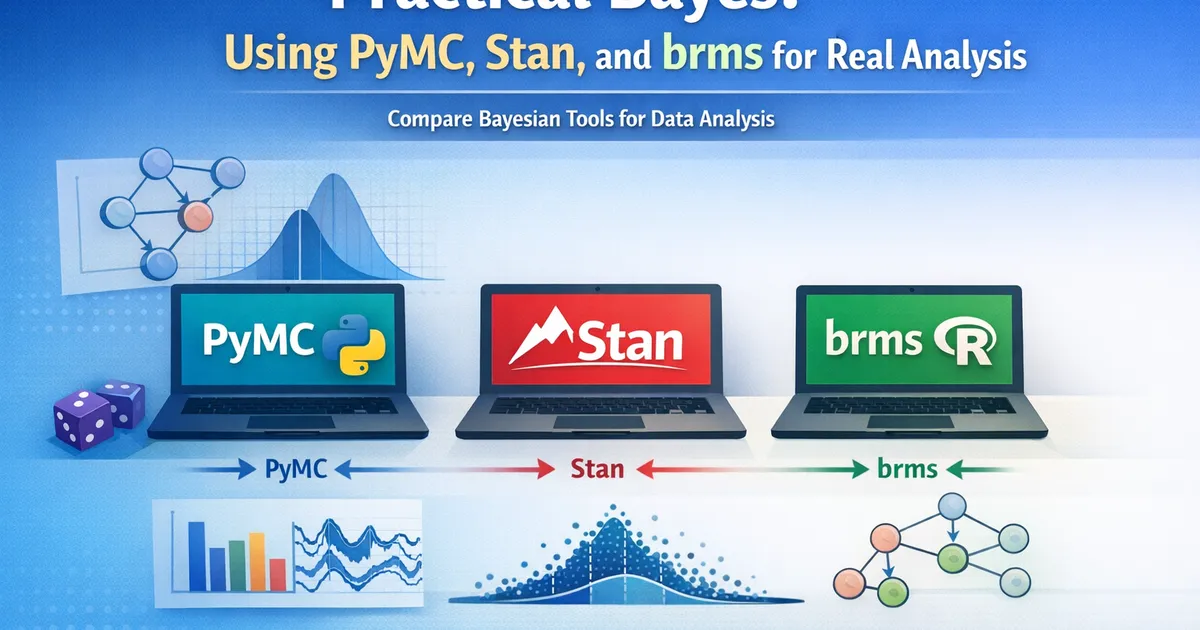
Practical Bayes: Using PyMC, Stan, and brms for Real Analysis
Hands-on guide to Bayesian tools. Compare PyMC, Stan, and brms with real examples. Learn which tool fits your workflow and how to get started fast.
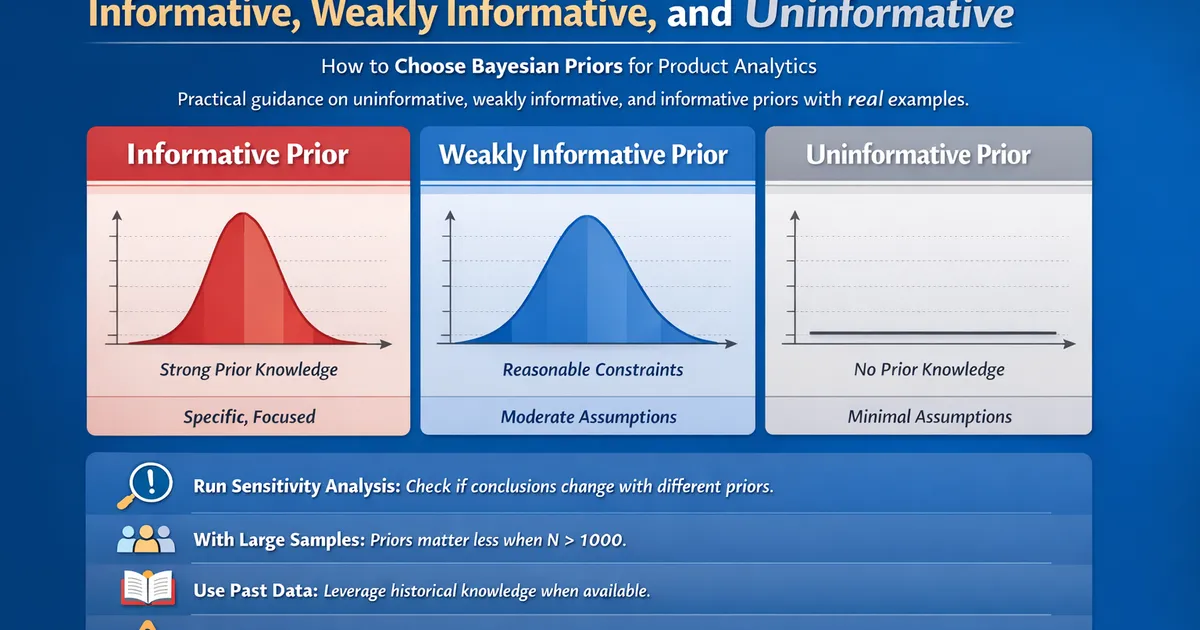
Prior Selection: Informative, Weakly Informative, and Uninformative
How to choose Bayesian priors for product analytics. Practical guidance on uninformative, weakly informative, and informative priors with real examples.
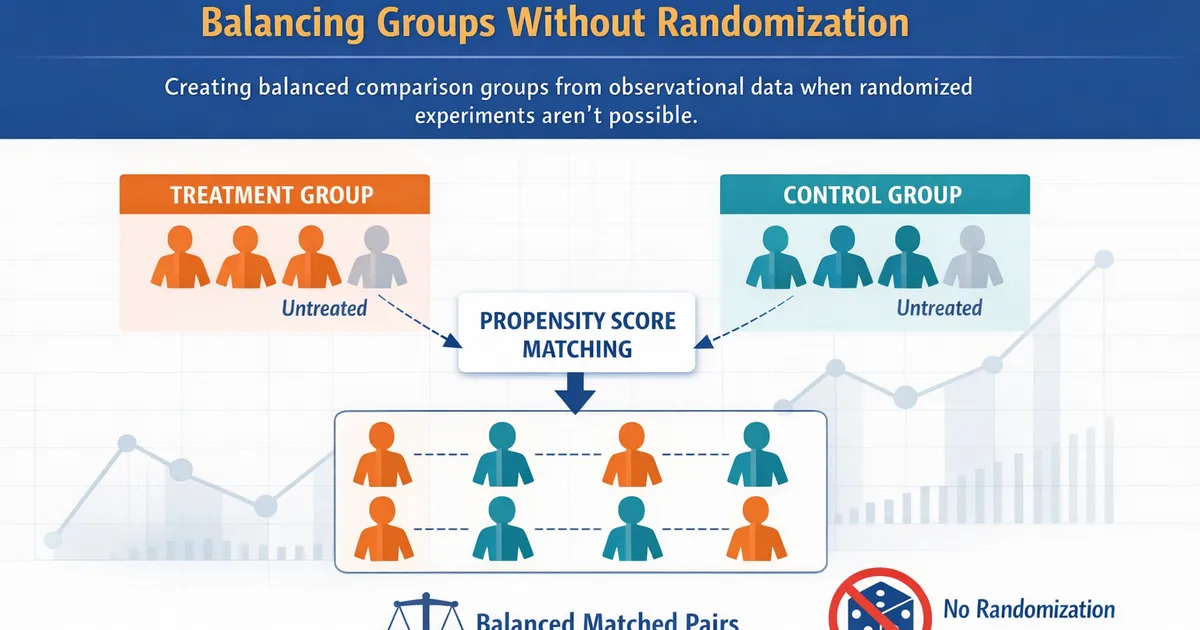
Propensity Score Matching: Balancing Groups Without Randomization
Learn how propensity score matching creates balanced comparison groups from observational data when randomized experiments aren't possible.
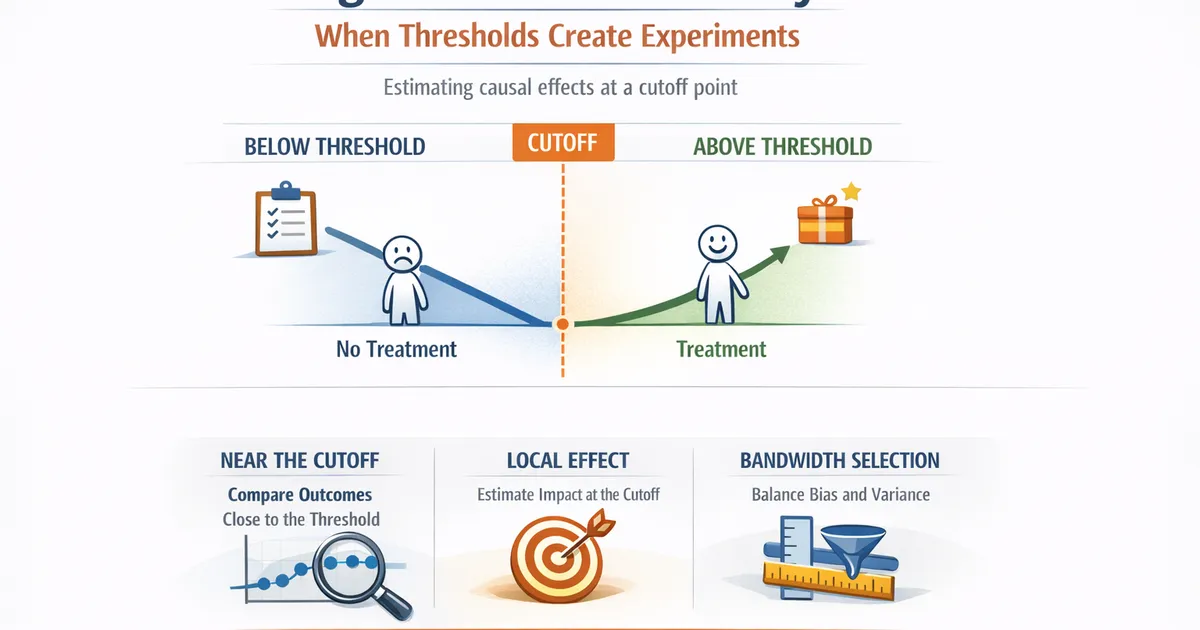
Regression Discontinuity: When Thresholds Create Experiments
How regression discontinuity designs exploit score cutoffs to estimate causal effects. A practical guide for product analysts with real-world examples.
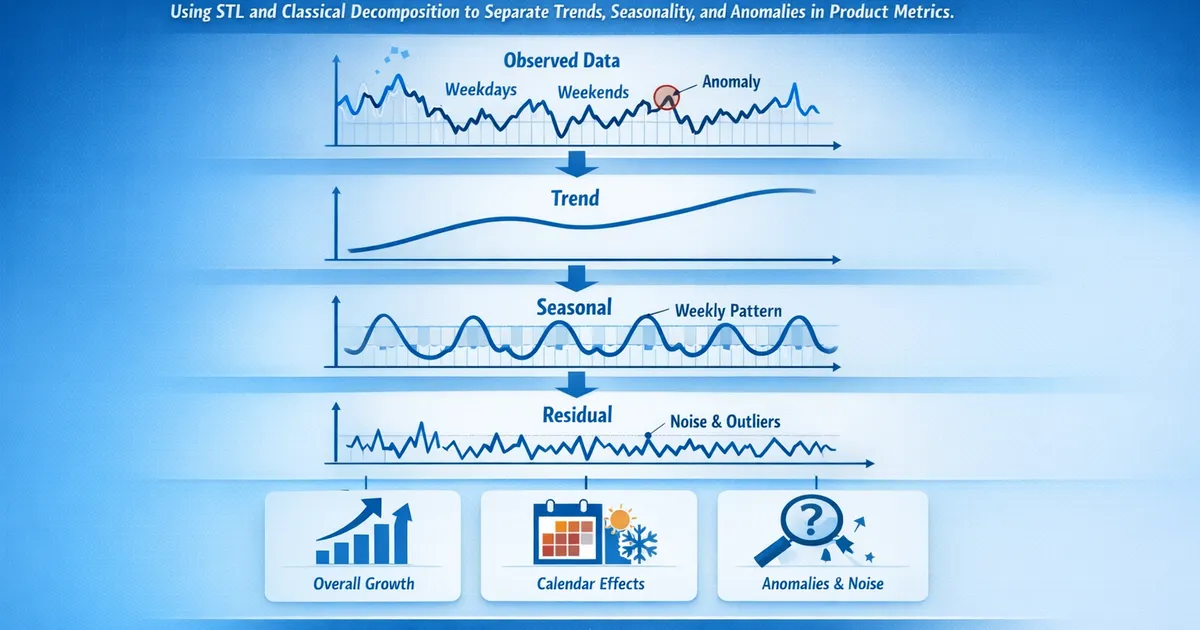
Seasonal Decomposition: Separating Signal from Calendar Effects
How to use STL and classical decomposition to separate trends, seasonality, and anomalies in product metrics.
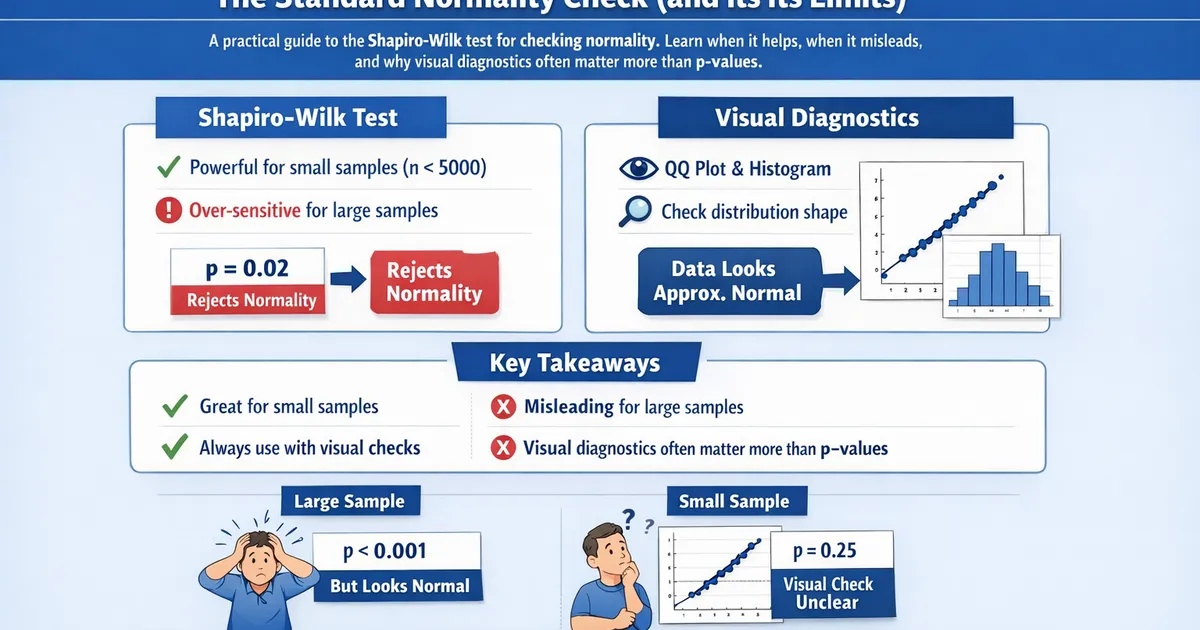
Shapiro-Wilk Test: The Standard Normality Check (and Its Limits)
A practical guide to the Shapiro-Wilk test for checking normality. Learn when it helps, when it misleads, and why visual diagnostics often matter more than p-values.
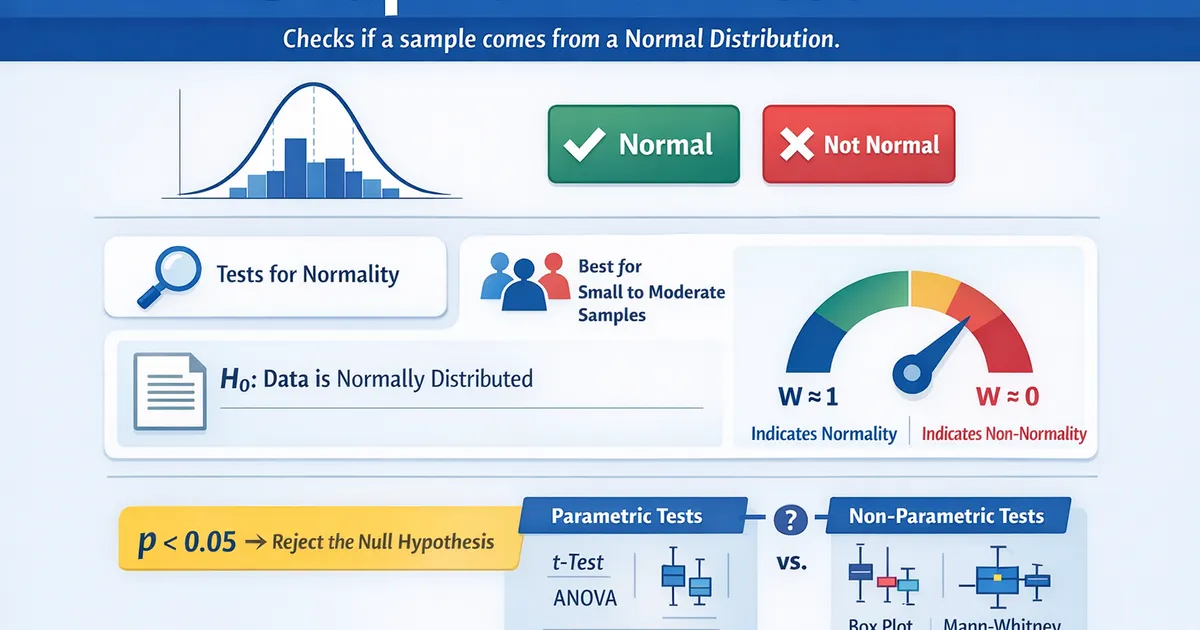
Shapiro-Wilk Test
The Shapiro-Wilk Test evaluates whether a sample comes from a normally distributed population. Use it to check the normality assumption before running parametric tests like t-tests or ANOVA.
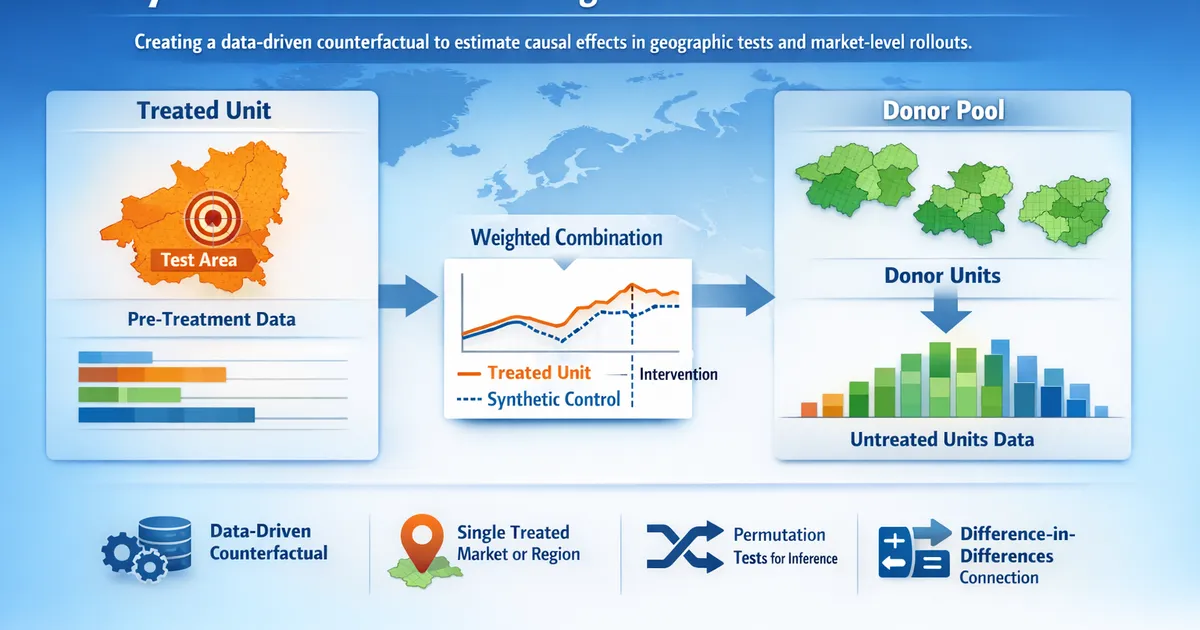
Synthetic Control: Building a Counterfactual for Geo Tests
How the synthetic control method builds a data-driven counterfactual from donor units to estimate causal effects in geo tests and market-level rollouts.
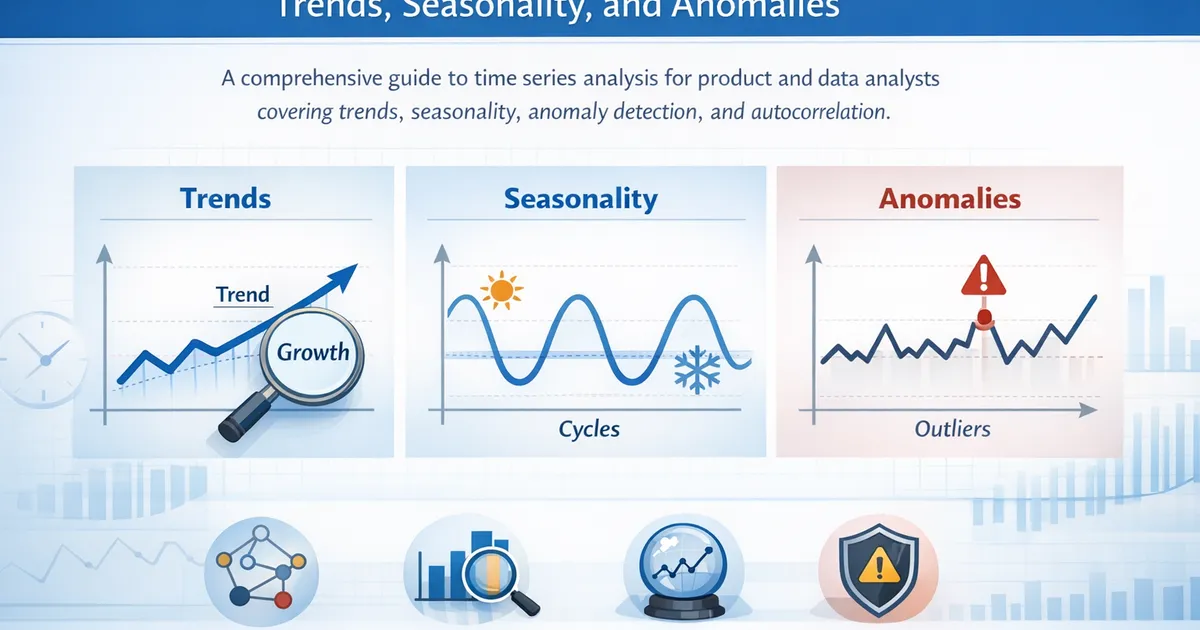
Time Series Analysis for Product Metrics: Trends, Seasonality, and Anomalies
A comprehensive guide to time series analysis for product and data analysts covering trends, seasonality, anomaly detection, and autocorrelation.
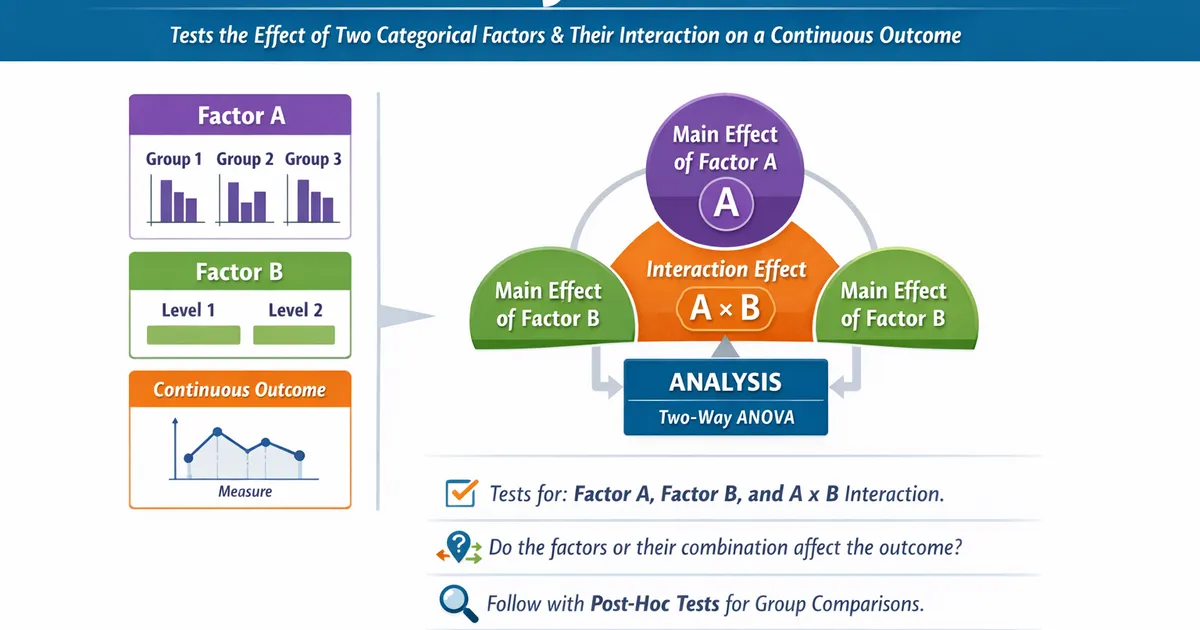
Two-Way ANOVA
Two-Way ANOVA tests the effect of two independent factors (and their interaction) on a continuous outcome. Use it when you have two categorical grouping variables and want to know if either or both affect your outcome.
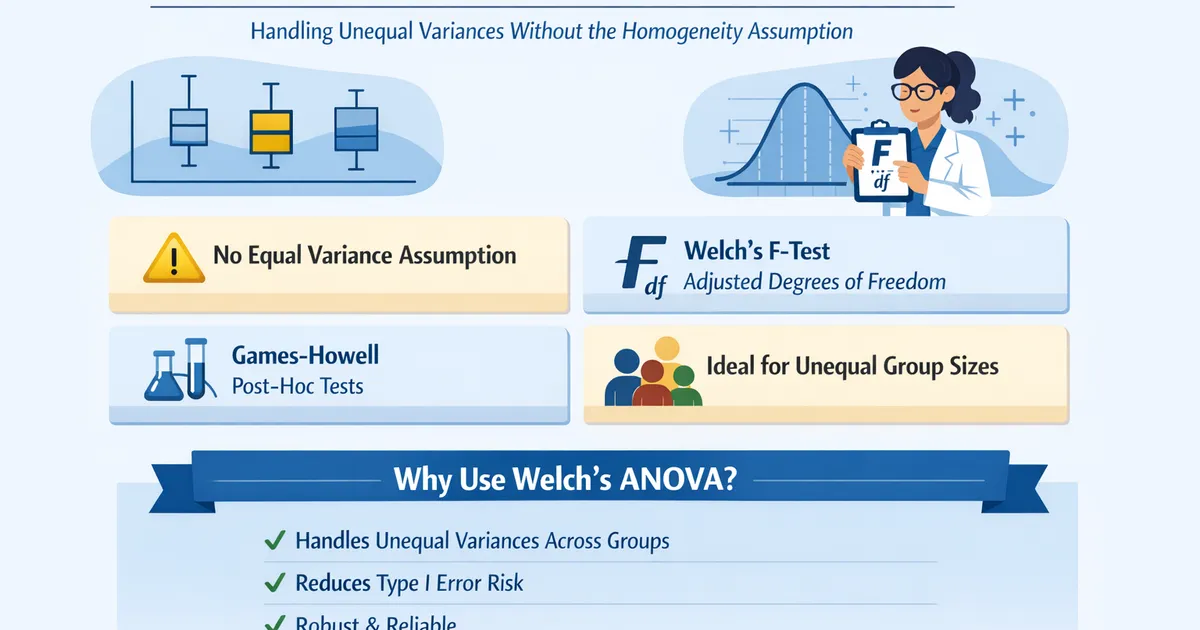
Welch's ANOVA: When Group Variances Differ
Welch's ANOVA handles unequal variances across groups without requiring the homogeneity assumption. Learn when to use it instead of standard one-way ANOVA and how to follow up.
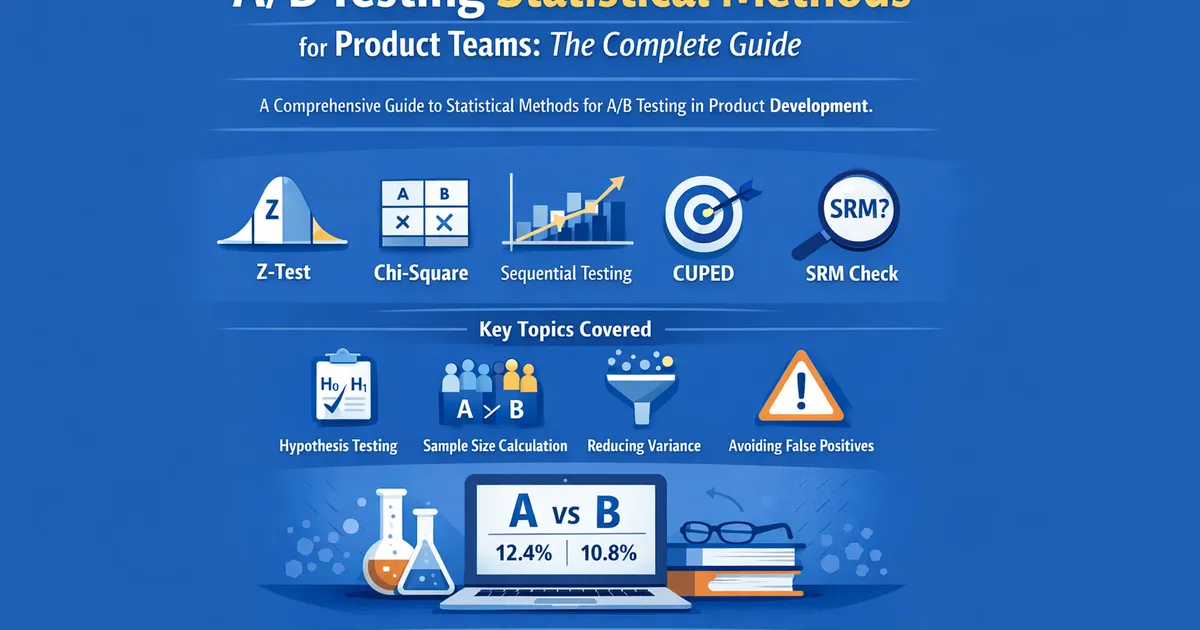
A/B Testing Statistical Methods for Product Teams: The Complete Guide
A comprehensive guide to statistical methods for A/B testing in product development. Learn when to use z-tests, chi-square, sequential testing, CUPED, and how to handle the real-world messiness of experimentation.