Contents
Shapiro-Wilk Test
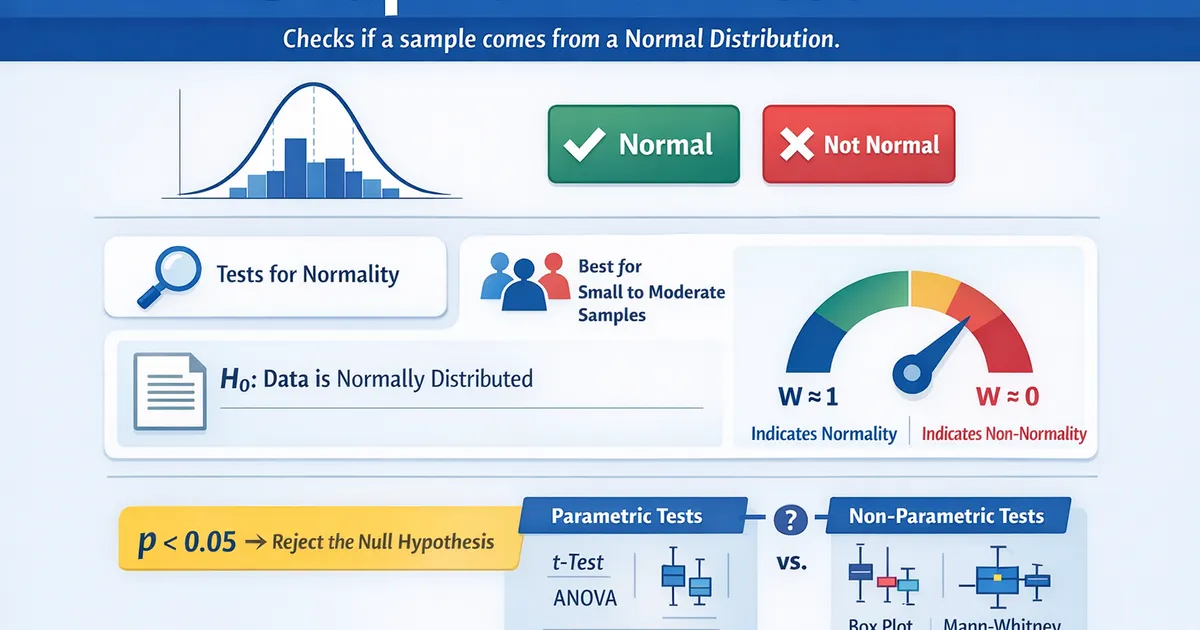
The Shapiro-Wilk Test evaluates whether a sample comes from a normally distributed population. Use it to check the normality assumption before running parametric tests like t-tests or ANOVA.
Quick Hits
- •Tests whether a sample comes from a normal distribution
- •Most powerful normality test for small to moderate samples (n < 5000)
- •Null hypothesis: the data IS normally distributed (rejecting means non-normal)
- •W statistic close to 1 indicates normality; close to 0 indicates departure
- •With large samples, even trivial deviations from normality will be flagged as significant
The StatsTest Flow: Difference or Goodness of Fit >> Testing Distribution Assumptions >> Is my data normally distributed?
Not sure this is the right statistical method? Use the Choose Your StatsTest workflow to select the right method.
What is the Shapiro-Wilk Test?
The Shapiro-Wilk Test is a statistical test that evaluates whether a sample of data comes from a normally distributed population. It is the most powerful test for normality for samples from 3 to approximately 5,000 observations.
The test produces a W statistic between 0 and 1. Values close to 1 indicate the data is consistent with a normal distribution; values significantly below 1 indicate departure from normality. The accompanying p-value tells you whether the departure is statistically significant.
The Shapiro-Wilk Test is also called the Shapiro-Wilk Normality Test or the W Test.
Assumptions for the Shapiro-Wilk Test
The assumptions for the Shapiro-Wilk Test include:
- Continuous Data
- Independent Observations
- Sample Size Between 3 and ~5,000
Continuous Data
The data should be continuous or at least measured on a scale fine enough to assess distributional shape. The test is not appropriate for categorical or ordinal data.
Independent Observations
Each data point should be independent. If observations are clustered or time-dependent, the test results may be misleading.
Sample Size
The Shapiro-Wilk test works best with sample sizes from 3 to about 5,000. For very large samples, the test becomes overly sensitive and will reject normality for trivially small deviations that have no practical impact on downstream analyses.
When to use the Shapiro-Wilk Test?
- You want to check if your data is normally distributed before running a parametric test
- Your sample size is small to moderate (n < 5,000)
- You need a formal statistical test of normality (rather than just visual inspection)
For comparing your data to distributions other than normal, use the Kolmogorov-Smirnov Test. For testing equal variances between groups, use Levene's Test.
Shapiro-Wilk Test Example
You plan to compare test scores between two teaching methods using an Independent Samples T-Test. Before running the t-test, you check whether the scores in each group are normally distributed.
Group 1 (Method A): W = 0.967, p = 0.42 -> No evidence against normality. Group 2 (Method B): W = 0.981, p = 0.71 -> No evidence against normality.
Since both groups pass the Shapiro-Wilk test (p > 0.05), the normality assumption for the t-test is satisfied. You proceed with the parametric test. If either group had a significant Shapiro-Wilk result with a clearly non-normal QQ plot, you would consider the Mann-Whitney U Test instead.
References
- https://www.ncbi.nlm.nih.gov/pmc/articles/PMC3693611/
- https://real-statistics.com/tests-normality-and-symmetry/statistical-tests-normality-symmetry/shapiro-wilk-test/
Frequently Asked Questions
My Shapiro-Wilk p-value is less than 0.05. Does that mean I can't use a t-test?
Should I always run a normality test before a t-test?
What is the difference between Shapiro-Wilk and Kolmogorov-Smirnov?
Key Takeaway
The Shapiro-Wilk test is the most widely used and most powerful formal test of normality for small to moderate samples. However, use it as one tool among several: QQ plots and histograms often provide more practical information about whether non-normality is severe enough to affect your analysis.