Contents
Shapiro-Wilk Test: The Standard Normality Check (and Its Limits)
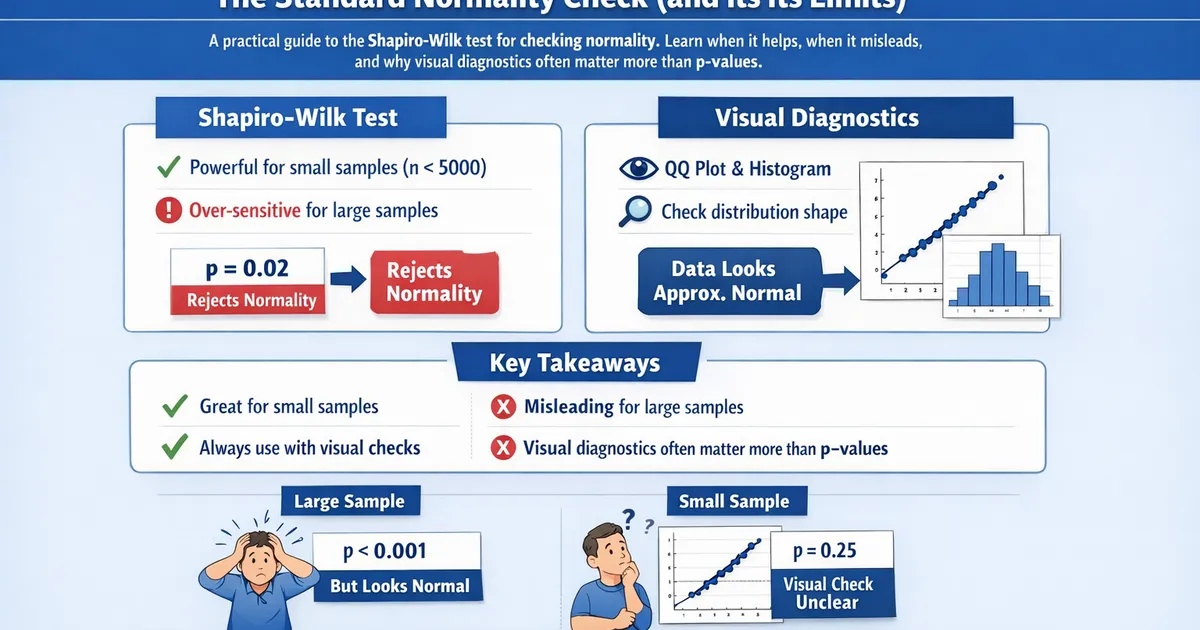
A practical guide to the Shapiro-Wilk test for checking normality. Learn when it helps, when it misleads, and why visual diagnostics often matter more than p-values.
Quick Hits
- •Shapiro-Wilk is the most powerful normality test for n < 5000
- •With large samples it rejects normality for trivial deviations that don't affect your analysis
- •With small samples it lacks power and may miss serious non-normality
- •Always pair with visual diagnostics: QQ plot and histogram
- •Many statisticians recommend skipping formal tests and just using visual checks
The Shapiro-Wilk Test is the standard formal test for normality, but knowing when to trust it — and when not to — is just as important as knowing how to run it.
The Paradox of Normality Testing
Normality tests have an awkward relationship with sample size:
- Small samples (n < 30): You need normality most (because the Central Limit Theorem hasn't kicked in), but the test lacks power to detect it.
- Large samples (n > 500): The test has excellent power, but you don't need normality as much (CLT makes parametric tests robust), and the test flags irrelevant deviations.
This means Shapiro-Wilk is most useful in the middle ground: samples of roughly 30-500 where both the assumption matters and the test has reasonable power.
A Practical Workflow
- Plot first: Create a QQ plot and histogram. Visual assessment catches the problems that actually matter (heavy tails, bimodality, severe skew).
- Run Shapiro-Wilk if n < 500 and the visual is ambiguous.
- Interpret carefully: A significant result means "not perfectly normal," not "your analysis is invalid." Check whether the departure is severe enough to affect your specific test.
- Consider alternatives: If non-normality is severe, use non-parametric tests like Mann-Whitney U or Kruskal-Wallis, or bootstrap confidence intervals.
What the W Statistic Tells You
The W statistic ranges from 0 to 1. Values close to 1 indicate the data is consistent with normality. As a rough guide:
| W Value | Interpretation |
|---|---|
| > 0.95 | Very close to normal |
| 0.90 - 0.95 | Moderate departure |
| < 0.90 | Substantial departure |
But always check the QQ plot regardless of the W value.
When to Skip the Formal Test
- n > 500: Use QQ plots only. The test will almost certainly reject.
- Obvious non-normality: If the histogram shows bimodality or extreme skew, you already know. No test needed.
- Robust methods: If you are using Welch's t-test, bootstrap CIs, or non-parametric methods, the normality assumption is less critical or irrelevant.
See also: Assumption Checks and What To Do When They Fail for a comprehensive guide to handling assumption violations.
References
- https://www.ncbi.nlm.nih.gov/pmc/articles/PMC3693611/
- https://www.tandfonline.com/doi/abs/10.1080/00031305.2017.1305291
Frequently Asked Questions
My Shapiro-Wilk test is significant but my QQ plot looks fine. What do I do?
Should I test normality on the raw data or the residuals?
What sample size is too large for Shapiro-Wilk?
Key Takeaway
The Shapiro-Wilk test is useful for small samples where visual assessment is unreliable, but it becomes counterproductive for large samples where it over-detects trivial departures. Use it as one input alongside QQ plots, not as a binary gate.