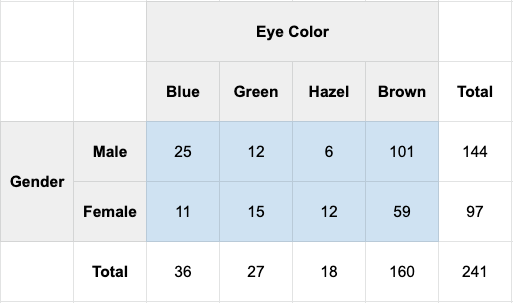
How big is your sample? Specifically, how big is each cell in your 2×2 or 2×3 or 2×4 contingency table? A contingency table is simply a 2×2 (or 2 by whatever) grid that has one of your groups on the top and one of your groups on the left.
– OR –
– OR –
More Than 10 In Every Cell (and more than 1000 in total)
More Information (if you need help deciding)
Less Than 10 In A Cell: This means that at least one of the cells in your contingency table (see Image 1 with the blue background) has fewer than 10 subjects or samples. For example, the Hazel eye color for Male subjects has a value of 6. This means you only have 6 subjects in this cell, which means you have less than 10 in a cell and you should choose this option.
More Than 10 In Every Cell: More than 10 in every cell means that you have decent coverage across all combinations of your group variables. For example, in the table below (see Image 1), if we increased the number of Male Hazel subjects to 16 instead of 6, then this would mean you have more than 10 in every cell
More Than 10 In Every Cell (and more than 1000 in total): This means you have more than 10 subjects or research participants in every cell AND your total sample size is greater than 1000. In Image 1 below, the total sample size is in the bottom right corner (n=241).
