The StatsTest Flow: Prediction >> Categorical Dependent Variable >> All Continuous Dependent Variables
Not sure this is the right statistical method? Use the Choose Your StatsTest workflow to select the right method.
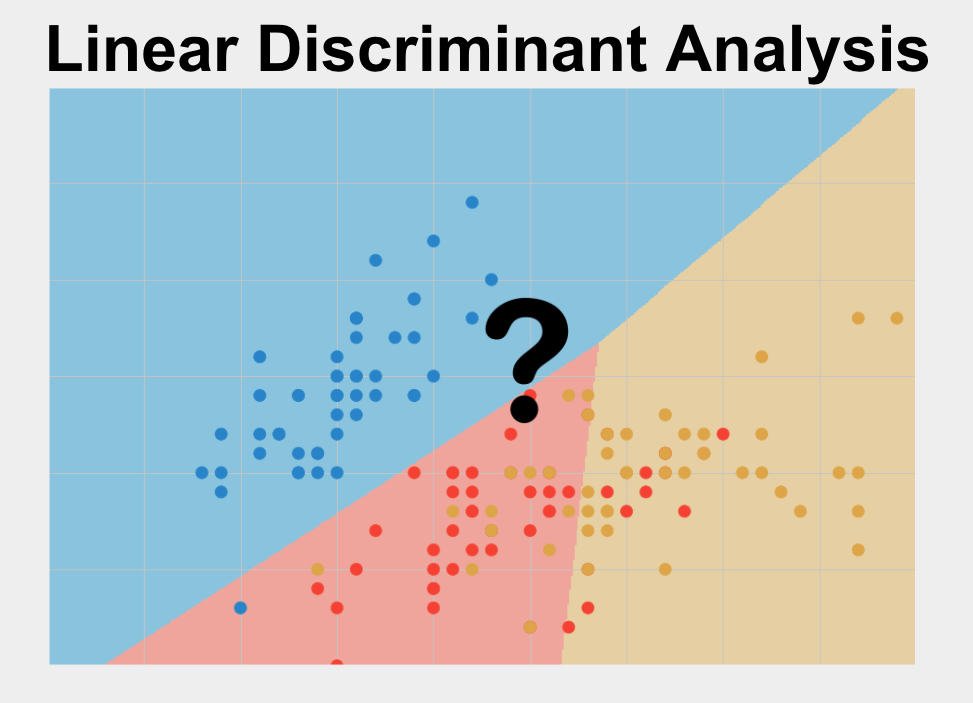
What is Linear Discriminant Analysis?
Linear Discriminant Analysis is a statistical test used to predict a single categorical variable using one or more other continuous variables. It also is used to determine the numerical relationship between such sets of variables. The variable you want to predict should be categorical and your data should meet the other assumptions listed below.
Linear Discriminant Analysis is sometimes also called normal discriminant analysis (NDA), or discriminant function analysis.
Assumptions for Linear Discriminant Analysis
Every statistical method has assumptions. Assumptions mean that your data must satisfy certain properties in order for statistical method results to be accurate.
The assumptions for Linear Discriminant Analysis include:
- Linearity
- No Outliers
- Independence
- No Multicollinearity
- Similar Spread Across Range
- Normality
Let’s dive in to each one of these separately.
Linearity
Logistic regression fits a logistic curve to binary data. This logistic curve can be interpreted as the probability associated with each outcome across independent variable values. Logistic regression assumes that the relationship between the natural log of these probabilities (when expressed as odds) and your predictor variable is linear.
No Outliers
The variables that you care about must not contain outliers. Logistic Regression is sensitive to outliers, or data points that have unusually large or small values. You can tell if your variables have outliers by plotting them and observing if any points are far from all other points.
Independence
Each of your observations (data points) should be independent. This means that each value of your variables doesn’t “depend” on any of the others. For example, this assumption is usually violated when there are multiple data points over time from the same unit of observation (e.g. subject/participant/customer/store), because the data points from the same unit of observation are likely to be related or affect one another.
No Multicollinearity
Multicollinearity refers to the scenario when two or more of the independent variables are substantially correlated amongst each other. When multicollinearity is present, the regression coefficients and statistical significance become unstable and less trustworthy, though it doesn’t affect how well the model fits the data per se.
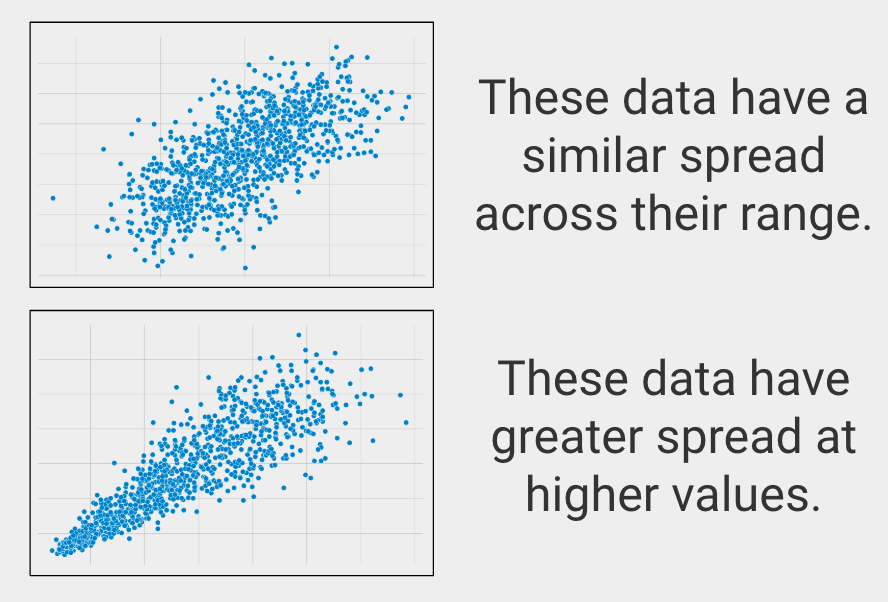
Similar Spread Across Range
In statistics this is called homoscedasticity, which describes when variables have a similar spread across their ranges.
Normality
Linear Discriminant Analysis assumes that the distribution of these your variables will match a normal (or bell curve) distribution shape.
When to use Linear Discriminant Analysis?
You should use Linear Discriminant Analysis in the following scenario:
- You want to use one variable in a prediction of another, or you want to quantify the numerical relationship between two variables
- The variable you want to predict (your dependent variable) is categorical
- Your dependent variables are all continuous
Let’s clarify these to help you know when to use Linear Discriminant Analysis
Prediction
You are looking for a statistical test to predict one variable using another. This is a prediction question. Other types of analyses include examining the strength of the relationship between two variables (correlation) or examining differences between groups (difference).
Categorical Dependent Variable
A categorical variable is a variable that describes a category that doesn’t relate naturally to a number. Examples of categorical variables are eye color, city of residence, type of dog, etc..
Types of data that are NOT categorical include ordered data (such as finishing place in a race, best business rankings, etc.), binary data (true/false, purchased the product or not, etc.), or continuous data (height, income, etc.).
If your dependent variable is continuous, you should use Simple Linear Regression, and if your dependent variable is binary, then you should use Simple Logistic Regression.
All Continuous
Linear Discriminant Analysis is used when each of the predictor variables is continuous.
If your independent variables are all continuous, then you can use Multinomial Logistic Regression.
Linear Discriminant Analysis Example
Dependent Variable: Website format preference (e.g. format A, B, C, etc)
Independent Variable 1: Consumer age
Independent Variable 2: Consumer income
The null hypothesis, which is statistical lingo for what would happen if the treatment does nothing, is that there is no relationship between consumer age/income and website format preference. Our test will assess the likelihood of this hypothesis being true.
We gather our data and observe that consumer income is not normally distributed, so we transform it to meet the normality assumption of this analysis.
One output of linear discriminant analysis is a formula describing the decision boundaries between website format preferences as a function of consumer age in income. In addition, the results of this analysis can be used to predict website preference using consumer age and income for other data points.
Frequently Asked Questions
Q: How do I run Linear Discriminant Analysis in SPSS or R?
A: This resource is focused on helping you pick the right statistical method every time. There are many resources available to help you figure out how to run this method with your data:
SPSS article: https://stats.idre.ucla.edu/spss/dae/discriminant-function-analysis/
SPSS video: https://www.youtube.com/watch?v=vm1OLoL_VuY
R article: http://www.sthda.com/english/articles/36-classification-methods-essentials/146-discriminant-analysis-essentials-in-r/
R video: https://www.youtube.com/watch?v=s8pvp2Ctxfc
Help!
If you still can’t figure something out, feel free to reach out.