The StatsTest Flow: Relationship >> At Least One Ordinal
Not sure this is the right statistical method? Use the Choose Your StatsTest workflow to select the right method.
What is Spearman’s Rho?
Spearman’s Rho is used to understand the strength of the relationship between two variables. Your variables of interest can be continuous or ordinal and should have a monotonic relationship. See more below.
Spearman’s Rho is also called Spearman’s correlation, Spearman’s rank correlation coefficient, Spearman’s rank-order correlation, and Spearman rho metric.
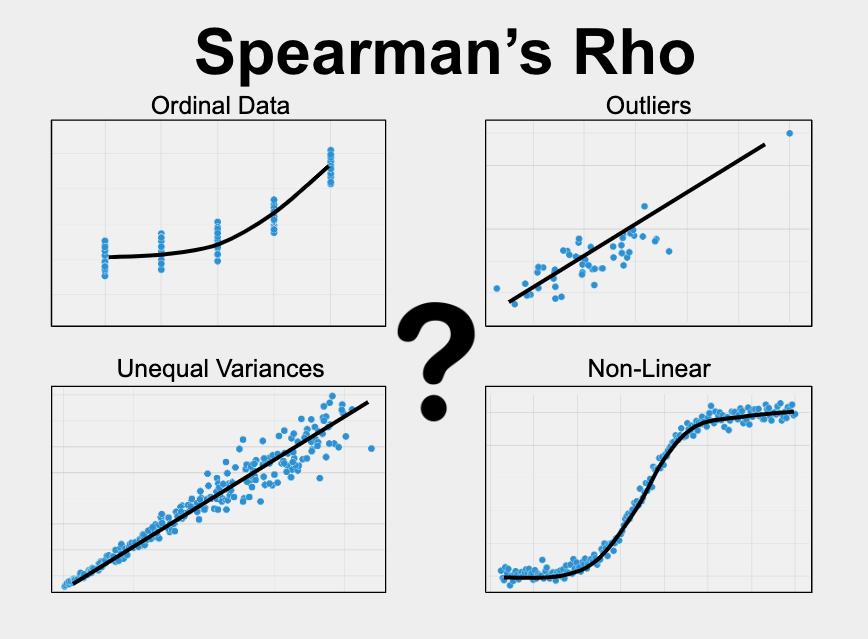
Assumptions for Spearman’s Rho
Every statistical method has assumptions. Assumptions mean that your data must satisfy certain properties in order for statistical method results to be accurate.
The assumptions for Spearman’s Rho include:
- Continuous or ordinal
- Monotonicity
Let’s dive in to each one of these separately.
Continuous or Ordinal
The variables that you care about must be continuous or ordinal. Continuous means that the variable can take on any reasonable value. Some good examples of continuous variables include age, weight, height, test scores, survey scores, yearly salary, etc. Spearman’s Rho is often used for correlation on continuous data if there are outliers in the data.
Ordinal variables are categories that have an inherent order. For instance, education level (GDE/Bachelors/Masters/PhD), income level (if grouped into high/medium/low) etc.
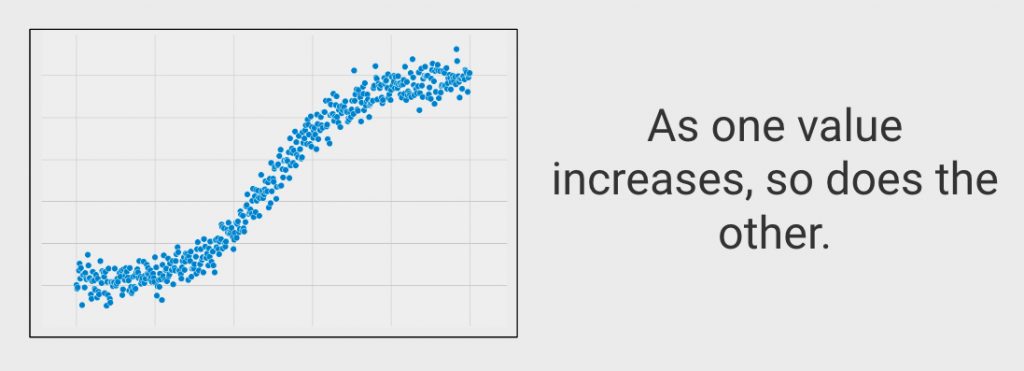
Monotonicity
Your two variables should have a monotonic relationship. This means that the direction of the relationship between the variables is consistent. For instance, when one variable goes up, the other goes up (in general). In this case, a plot of the two variables would move consistently in the up-right direction. The relationship would also be monotonic if when one variable goes up, the other goes down (in general). In this case, the plot of the two variables would move consistently in the down-right direction.
When to use Spearman’s Rho?
You should use Spearman’s Rho in the following scenario:
- You want to know the relationship between two variables
- Your variables of interest are continuous with outliers or ordinal
- You have only two variables
Let’s clarify these to help you know when to use Spearman’s Rho
Relationship
You are looking for a statistical test to look at how two variables are related. Other types of analyses include testing for a difference between two variables or predicting one variable using another variable (prediction).
Continuous with Outliers or Ordinal
Your variable of interest must be either continuous or ordinal. Continuous means that your variable of interest can basically take on any value, such as heart rate, height, weight, number of ice cream bars you can eat in 1 minute, etc. Spearman’s Rho is often used on continuous data when the data have outliers.
Ordinal variables are categories that have an inherent order. For instance, education level (GDE/Bachelors/Masters/PhD), income level (if grouped into high/medium/low) etc.
If your data are continuous and do not have outliers, you should probably use Pearson Correlation instead. If one of your variables is continuous and the other is binary, you should use Point Biserial Correlation. And if your variables are categorical, you should use the Phi Coefficient or Cramer’s V.
Two Variables
Spearman’s Rho can only be used to compare two variables.
Spearman’s Rho Example
Variable 1: Hours worked per week.
Variable 2: Income.
In this example, we are interested in investigating the relationship between a person’s average hours worked per week and income. To begin, we collect these data from a group of people.
Depending on the population, one or both of these variables is likely skewed, or does not fit a bell curve. For this reason, we use Spearman’s Rho instead of Pearson Correlation. We double check that the other assumptions of Spearman’s Rho are met.
The analysis will result in a correlation coefficient (called “Rho”) and a p-value. Rho values range from -1 to 1. A negative value of r indicates that the variables are inversely related, or when one variable increases, the other decreases. On the other hand, positive values indicate that when one variable increases, so does the other.
The p-value represents the chance of seeing our results if there was no actual relationship between our variables. A p-value less than or equal to 0.05 means that our result is statistically significant and we can trust that the difference is not due to chance alone.
Frequently Asked Questions
Q: What is the difference between Spearman’s Rho and Kendall’s Tau?
A: Spearman’s Rho and Kendall’s Tau are very similar tests and are used in similar scenarios. We recommend using Kendall’s Tau first and Spearman’s Rho as a backup.
Q: How do I run Spearman’s Rho in SPSS or R?
A: StatsTest is focused on helping you pick the right statistical method every time. There are many resources available to help you figure out how to run this method with your data:
SPSS article: https://statistics.laerd.com/spss-tutorials/spearmans-rank-order-correlation-using-spss-statistics.php
SPSS video: https://www.youtube.com/watch?v=HgE2y2yte0I
R article: https://rpubs.com/aaronsc32/spearman-rank-correlation
R video: https://www.youtube.com/watch?v=C3XMP8TnZZw
Help!
If you still can’t figure something out, feel free to reach out.