The StatsTest Flow: Prediction >> Binary Dependent Variable >> More than One Independent Variable >> No Repeated Measures
Not sure this is the right statistical method? Use the Choose Your StatsTest workflow to select the right method.
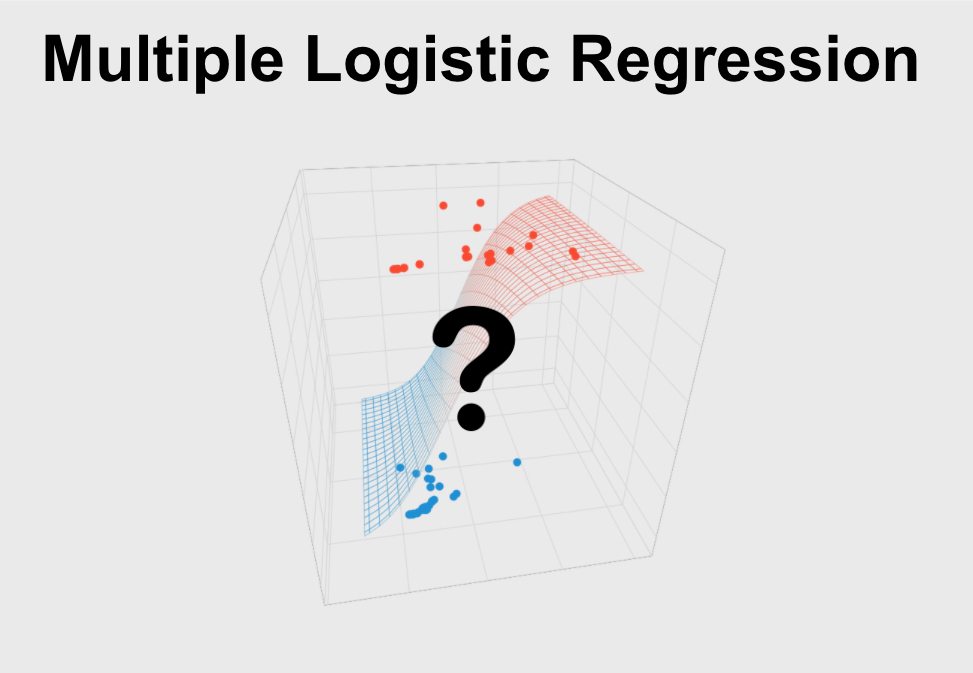
What is Multiple Logistic Regression?
Multiple Logistic Regression is a statistical test used to predict a single binary variable using one or more other variables. It also is used to determine the numerical relationship between such a set of variables. The variable you want to predict should be binary and your data should meet the other assumptions listed below.
Simple Logistic Regression is sometimes also called Logit Regression, or Binary Logistic Regression.
Assumptions for Multiple Logistic Regression
Every statistical method has assumptions. Assumptions mean that your data must satisfy certain properties in order for statistical method results to be accurate.
The assumptions for Multiple Logistic Regression include:
- Linearity
- No Outliers
- Independence
- No Multicollinearity
Let’s dive in to each one of these separately.
Linearity
Logistic regression fits a logistic curve to binary data. This logistic curve can be interpreted as the probability associated with each outcome across independent variable values. Logistic regression assumes that the relationship between the natural log of these probabilities (when expressed as odds) and your predictor variable is linear.
No Outliers
The variables that you care about must not contain outliers. Logistic Regression is sensitive to outliers, or data points that have unusually large or small values. You can tell if your variables have outliers by plotting them and observing if any points are far from all other points.
Independence
Each of your observations (data points) should be independent. This means that each value of your variables doesn’t “depend” on any of the others. For example, this assumption is usually violated when there are multiple data points over time from the same unit of observation (e.g. subject/participant/customer/store), because the data points from the same unit of observation are likely to be related or affect one another.
If your data have repeated measures over time from the same units of observation, you should use Mixed Effects Logistic Regression.
No Multicollinearity
Multicollinearity refers to the scenario when two or more of the independent variables are substantially correlated amongst each other. When multicollinearity is present, the regression coefficients and statistical significance become unstable and less trustworthy, though it doesn’t affect how well the model fits the data per se.
When to use Multiple Logistic Regression?
You should use Multiple Logistic Regression in the following scenario:
- You want to use one or more variables in a prediction of another, or you want to quantify the numerical relationship between these variables
- The variable you want to predict (your dependent variable) is binary
- You have one or more independent variable, or variable(s) that you are using as a predictor
Let’s clarify these to help you know when to use Multiple Logistic Regression
Prediction
You are looking for a statistical test to predict one variable using another. This is a prediction question. Other types of analyses include examining the strength of the relationship between two variables (correlation) or examining differences between groups (difference).
Binary Dependent Variable
The variable you want to predict must be binary. Binary data have only two possible values. Some examples of binary data include: true/false, purchased the product or not, has the disease or not, etc.
Types of data that are NOT binary include ordered data (such as finishing place in a race, best business rankings, etc.), categorical data (gender, eye color, race, etc.), or continuous data (height, income, etc.).
If your dependent variable is continuous, you should use Multiple Linear Regression, and if your dependent variable is categorical, then you should use Multinomial Logistic Regression or Linear Discriminant Analysis.
More than One Independent Variable
Multiple Logistic Regression is used when there is one or more predictor variables measured at a single point in time.
If you have only one independent variable, then you should use Simple Logistic Regression.
No Repeated Measures
This method is suited for the scenario when there is only one observation for each unit of observation. The unit of observation is what composes a “data point”, for example, a store, a customer, a city, etc…
If you have one or more independent variables, but they are measured for the same group at multiple points in time, then you should use Mixed Effects Logistic Regression.
Multiple Logistic Regression Example
Dependent Variable: Purchase made (Yes/No)
Independent Variable 1: Consumer income
Independent Variable 2: Consumer age
The null hypothesis, which is statistical lingo for what would happen if the treatment does nothing, is that there is no relationship between consumer income/age and whether or not a purchase is made. Our test will assess the likelihood of this hypothesis being true.
We gather our data and after assuring that the assumptions of logistic regression are met, we perform the analysis.
When we run this analysis, we get coefficients and p-values for each term in the model. The coefficients for our independent variables consumer income and consumer age is the expected increase/decrease in the log odds of our outcome variable for each unit increase in that variable.
The p-value associated with each of these coefficients is the chance of seeing our results assuming there is actually no relationship between consumer income/age and whether or not a purchase is made. A p-value less than or equal to 0.05 means that our result is statistically significant and we can trust that the difference is not due to chance alone.
In addition, this analysis will result in an accuracy measure. Accuracy is the proportion of the binary outcome variable that is correctly predicting using the logistic regression model. In this example, the accuracy would be the number of customers that the model correctly identified as making a purchase or not.
Frequently Asked Questions
Q: How do I run Multiple Logistic Regression in SPSS, R, SAS, or STATA?
A: This resource is focused on helping you pick the right statistical method every time. There are many resources available to help you figure out how to run this method with your data:
SPSS article: https://statistics.laerd.com/spss-tutorials/binomial-logistic-regression-using-spss-statistics.php
SPSS video: https://www.youtube.com/watch?v=fwxFz32L-AE
R article: https://rcompanion.org/rcompanion/e_07.html
R video: https://www.youtube.com/watch?v=XycruVLySDg
Help!
If you still can’t figure something out, feel free to reach out.