The StatsTest Flow: Difference >> Proportional or Categorical >> Two Group Variables >> Two Options >> Paired Samples
Not sure this is the right statistical method? Use the Choose Your StatsTest workflow to select the right method.
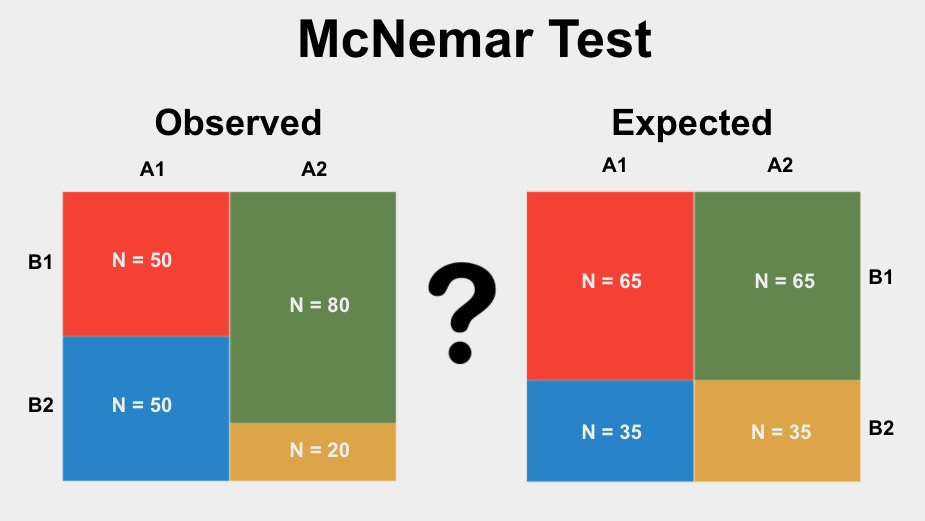
What is the McNemar Test?
The McNemar Test is a statistical test used to determine if the proportions of categories in two related groups significantly differ from each other. To use this test, you should have two group variables with two or more options. See more below.
The McNemar Test is also called the Paired Sample Z-Test, the Paired Sample Proportion Z-Test, and the Paired Proportion Z-Test.
Assumptions for the McNemar Test
Every statistical method has assumptions. Assumptions mean that your data must satisfy certain properties in order for statistical method results to be accurate.
The assumptions for the McNemar Test include:
- Random Sample
- Independence
- Mutually exclusive groups
Let’s dive into what that means.
Random Sample
The data points for each group in your analysis must have come from a simple random sample. This is important because if your groups were not randomly determined then your analysis will be incorrect. In statistical terms this is called bias, or a tendency to have incorrect results because of bad data.
Paired Samples
Paired samples means that your two “groups” consist of data from the same group observed at multiple points in time. For example, if you randomly sample men at two points in time to get their IQ score, then the two observations are paired.
Mutually Exclusive Groups
The two groups of your categorical variable should be mutually exclusive. For example, if your categorical variable is hungry (yes/no), then your groups are mutually exclusive, because one person cannot belong to both groups at once.
When to use the McNemar Test?
You should use the McNemar Test in the following scenario:
- You want to test the difference between two variables
- Your variable of interest is proportional or categorical
- You have two options
- You have paired samples
- You have more than 10 in every cell
Let’s clarify these to help you know when to use the McNemar Test.
Difference
You are looking for a statistical test to look at how a variable differs between two groups. Other types of analyses include testing for a relationship between two variables or predicting one variable using another variable (prediction).
Proportional or Categorical
For this test, your variable of interest must be proportional or categorical. A categorical variable is a variable that contains categories without a natural order. Examples of categorical variables are eye color, city of residence, type of dog, etc. Proportional variables are derived from categorical variables, for instance: the number of people that converted on two different versions of your website (10% vs 15%), percentages, the number of people who voted vs people who did not vote, the proportion of plants that died vs survived an experimental treatment, etc.
If you want to compare two continuous variables, you may want to use a Paired Samples T-Test.
Two Options
Your categorical variables should have two possible options. Some examples of variables like this are made a purchase (yes/no), color (black/white/red/etc), recovered from disease (yes/no).
Paired Samples
Paired samples means that your two “groups” consist of data from the same group observed at multiple points in time. For example, if you randomly sample men at two points in time to get their IQ score, then the two observations are paired.
McNemar Test Example
Group: Point in Time (1/2)
Variable: Recovered from disease (yes/no)
In this example, we are interested in investigating whether our two groups (i.e. time points) differ significantly in rate of recovery from disease. The null hypothesis is that there is no difference between recovery rates between the two measurements.
Because our variable has two or more possible values (yes/no), and our two groups are paired (repeated measures from the same group), we know that the McNemar Test is appropriate to use.
The analysis will result in a p-value. The p-value represents the chance of seeing our results if there was actually no difference in recovery rate between the two treatment types. A p-value less than or equal to 0.05 means that our result is statistically significant and we can trust that the difference is not due to chance alone.
Frequently Asked Questions
Q: How do I run the McNemar Test in R or SPSS?
A: StatsTest is focused on helping you pick the right statistical method every time. There are many resources available to help you figure out how to run this method with your data:
R article: https://www.datascienceblog.net/post/statistical_test/mcnemars_test/
R video: https://www.youtube.com/watch?v=-024la-UVlw
SPSS video: https://www.youtube.com/watch?v=r6l6wIWg6tI
SPSS article: https://statistics.laerd.com/spss-tutorials/mcnemars-test-using-spss-statistics.php
Help!
If you still can’t figure something out, feel free to reach out.