Contents
Independent Samples Z-Test
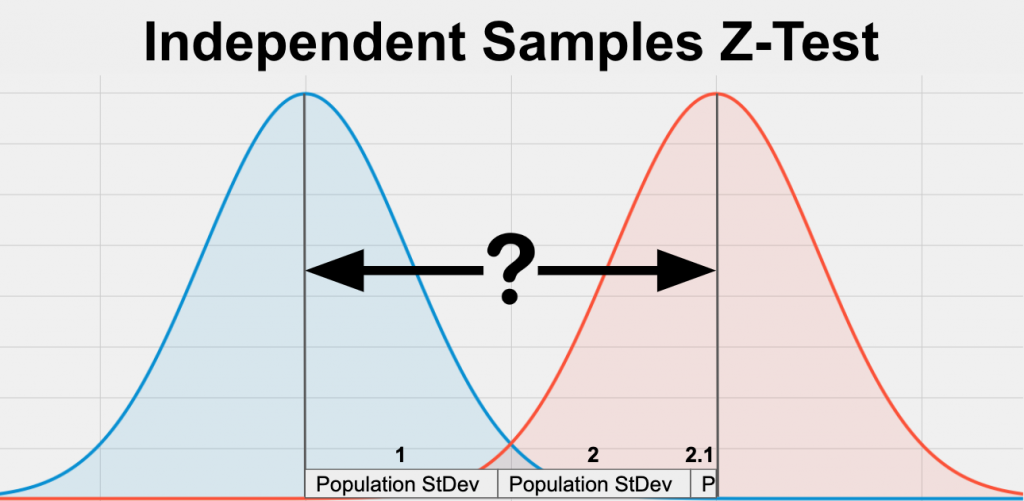
An independent samples z-test is used to determine if 2 groups are significantly different from each other on your variable of interest.
The StatsTest Flow: Difference >> Continuous Variable of Interest >> Two Sample Tests (2 groups) >> Independent Samples >> Normal Variable of Interest (and population variance known)
Not sure this is the right statistical method? Use the Choose Your StatsTest workflow to select the right method.
What is an Independent Samples Z-Test?
The Independent Samples Z-Test is a statistical test used to determine if 2 groups are significantly different from each other on your variable of interest. Your variable of interest should be continuous, be normally distributed, and have a similar spread between your 2 groups. Your 2 groups should be independent (not related to each other), you should have enough data (more than 5 values in each group), and you have to know the the population variance (or how spread out the variable tends to be).
The Independent Samples Z-Test is also called the Two-Sample Z-Test or Z-Test for Independent Samples.
Assumptions for an Independent Samples Z-Test
Every statistical method has assumptions. Assumptions mean that your data must satisfy certain properties in order for statistical method results to be accurate.
The assumptions for the Independent Samples Z-Test include:
- Continuous
- Normally Distributed
- Random Sample
- Enough Data
- Similar Spread Between Groups
Let's dive in to each one of these separately.
Continuous
The variable that you care about (and want to see if it is different between the two groups) must be continuous. Continuous means that the variable can take on any reasonable value.
Some good examples of continuous variables include age, weight, height, test scores, survey scores, yearly salary, etc.
If the variable that you care about is a proportion (48% of males voted vs 56% of females voted) then you should probably use the Two Proportion Z-Test instead.
Normally Distributed
The variable that you care about must be spread out in a normal way. In statistics, this is called being normally distributed (aka it must look like a bell curve when you graph the data). Only use an independent samples z-test with your data if the variable you care about is normally distributed.
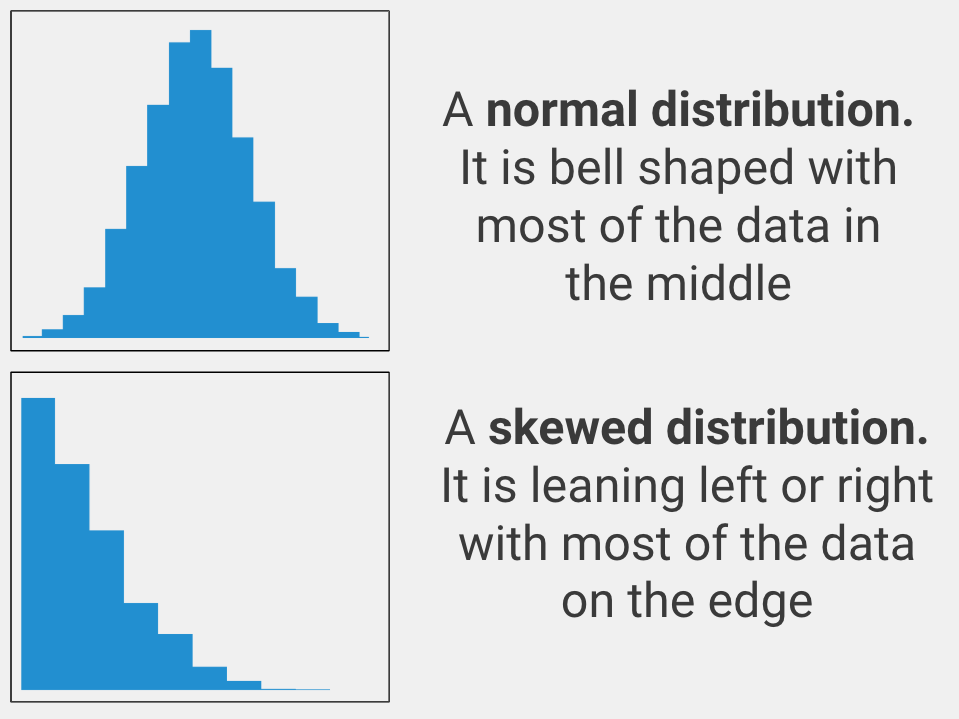
If your variable is not normally distributed, you should use the Mann-Whitney U Test instead.
Random Sample
The data points for each group in your analysis must have come from a simple random sample. This means that if you wanted to see if drinking sugary soda makes you gain weight, you would need to randomly select a group of soda drinkers for your soda drinker group, and then randomly select a group of non-soda drinkers for your non-soda drinking group.
The key here is that the data points for each group were randomly selected. This is important because if your groups were not randomly determined then your analysis will be incorrect. In statistical terms this is called bias, or a tendency to have incorrect results because of bad data.
If you do not have a random sample, the conclusions you can draw from your results are very limited. You should try to get a simple random sample. If you have paired samples (2 measurements from the same group of subjects) then you should use a Paired Samples T-Test instead.
Enough Data
The sample size (or data set size) should be greater than 5 in each group. Some people argue for more, but more than 5 is probably sufficient.
The sample size also depends on the expected size of the difference between groups. If you expect a large difference between groups, then you can get away with a smaller sample size. If you expect a small difference between groups, then you likely need a larger sample.
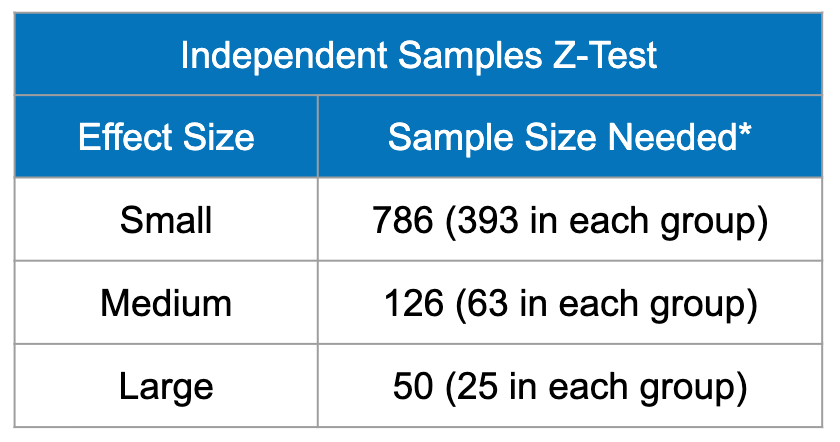
*sample size calculation was conducted in G*Power with a power of 0.80, critical value (), and 0.20, 0.50, and 0.80 used as the effect size values for small, medium, and large Cohen’s D effect sizes respectively
If your sample size is less than 30 (or you don't know the variance or spread of the population), you should run an Independent Samples T-Test instead.
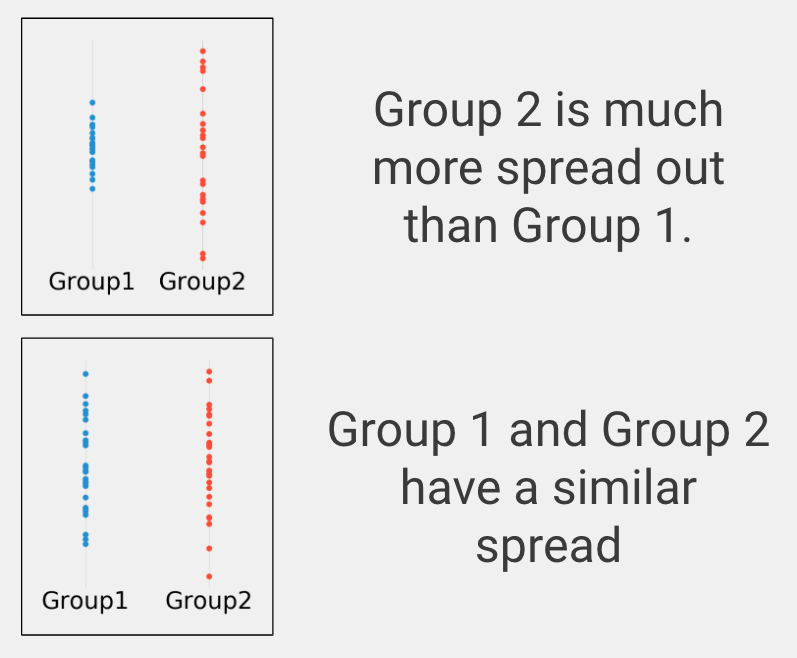
Similar Spread Between Groups
In statistics this is called homogeneity of variance, or making sure the variables take on reasonably similar values.
For example, suppose one group takes on values between -4 and 4 and another group also takes on values between -4 and 4. The standard deviation (a measure of how spread out data is) of the first group is 1.73 and the standard deviation of the second group is 1.69. Also suppose one group is normally distributed while the second group is skewed. While we would not use these two data sets to run an independent samples z-test (because one of the groups is not normally distributed), the two images have a similar spread between groups.
If your groups have a substantially different spread on your variable of interest, then you should use the Welch t-test statistic instead (frequently reported alongside the independent samples t-test when you run it in statistical software).
When to use an Independent Samples Z-Test?
You should use an Independent Samples Z-Test in the following scenario:
- You want to know if two groups are different on your variable of interest
- Your variable of interest is continuous
- You have two and only two groups
- You have independent samples
- You have a normal variable of interest (and population variance is known)
Let's clarify these to help you know when to use an Independent Samples Z-Test.
Difference
You are looking for a statistical test to see whether two groups are significantly different on your variable of interest. This is a difference question. Other types of analyses include examining the relationship between two variables (correlation) or predicting one variable using another variable (prediction).
Continuous Data
Your variable of interest must be continuous. Continuous means that your variable of interest can basically take on any value, such as heart rate, height, weight, number of ice cream bars you can eat in 1 minute, etc.
Types of data that are NOT continuous include ordered data (such as finishing place in a race, best business rankings, etc.), categorical data (gender, eye color, race, etc.), or binary data (purchased the product or not, has the disease or not, etc.).
Two Groups
An Independent Samples Z-Test can only be used to compare two groups on your variable of interest.
If you have three or more groups, you should use a One Way Anova analysis instead. If you only have one group and you would like to compare your group to a known or hypothesized population value, you should use a Single Sample T-Test instead.
Independent Samples
Independent samples means that your two groups are not related in any way. For example, if you randomly sample men and then separately randomly sample women to get their heights, the groups should not be related.
If you get a group of students to take a pre-test and the same students to take a post-test, you have two different variables for the same group of students, which would be paired data, in which case you would need to use a Paired Samples T-Test instead.
Normal Variable of Interest
Normality was discussed earlier on this page and simply means your plotted data is bell shaped with most of the data in the middle. If you actually would like to prove that your data is normal, you can use the Kolmogorov-Smirnov test or the Shapiro-Wilk test.
In addition to having a normally distributed variable of interest, you must also know the population standard deviation (or variance). This means you have to know how spread out the values are for your variable of interest in the general population.
Independent Samples Z-Test Example
Group 1: Received the experimental medical treatment.
Group 2: Received a placebo or control condition.
Variable of interest: Time to recover from the disease in days.
In this example, group 1 is our treatment group because they received the experimental medical treatment. Group 2 is our control group because they received the control condition.
The null hypothesis, which is statistical lingo for what would happen if the treatment does nothing, is that group 1 and group 2 will recover from the disease in about the same number of days, on average. We are trying to determine if receiving the experimental medical treatment will shorten the number of days it takes for patients to recover from the disease.
As we run the experiment, we track how long it takes for each patient to fully recover from the disease. In order to use an Independent Samples Z-Test on our data, our variable of interest has to be normally distributed (bell curve shaped). In this case, recovery from the disease in days is normal for both groups.
We also need to know the population standard deviation (or variance). This is simply how spread out the population is on your variable of interest. Luckily, there are published population recovery metrics we can use.
After the experiment is over, we compare the two groups on our variable of interest (days to fully recover) using an Independent Samples Z-Test. When we run the analysis, we get a z-statistic and a p-value.
The z-statistic is a measure of how different the two groups are on our recovery variable of interest. A p-value is the chance of seeing our results assuming the treatment actually doesn't do anything. A -value means that our result is statistically significant and we can trust that the difference is not due to chance alone.