Contents
Paired Samples (repeated measurements)
What does a histogram of your variable of interest look like? Normal Variable of Interest - OR - Skewed Variable of Interest More Information (if you need help deciding) In orde...
What does a histogram of your variable of interest look like?
- OR -
More Information (if you need help deciding)
In order to answer the following questions you are going to have to plot a histogram of your variable of interest. When you look at your histogram, you will need to determine if it is normal (bell shaped with most of the data residing in the center) or skewed (leaning right or left with most of the data not in the center).
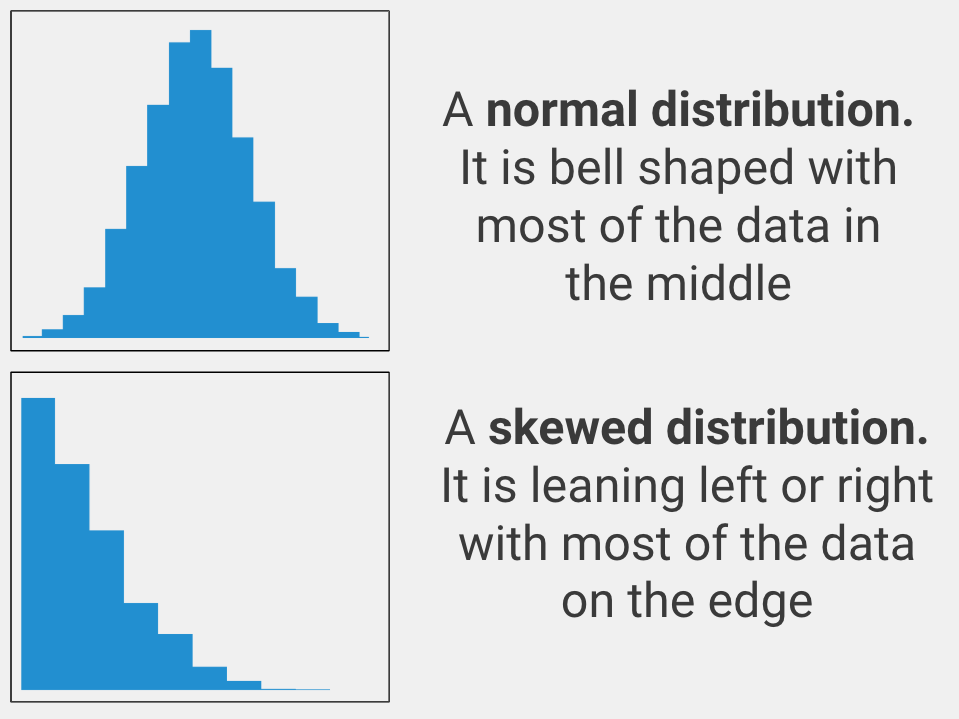
Normal Variable of Interest: a normal variable is one that looks like a bell curve with the majority of the data sitting in the center of a histogram plot of the data (see Image 1)
Skewed Variable of Interest: a skewed variable is one that looks like it is leaning right or left when you plot a histogram of the data (see Image 2). Notice it is leaning right and the majority of the data is on the right side of the graph rather than in the center.