The StatsTest Flow: Prediction >> Continuous Dependent Variable >> More than One Independent Variable >> Repeated Measures
Not sure this is the right statistical method? Use the Choose Your StatsTest workflow to select the right method.
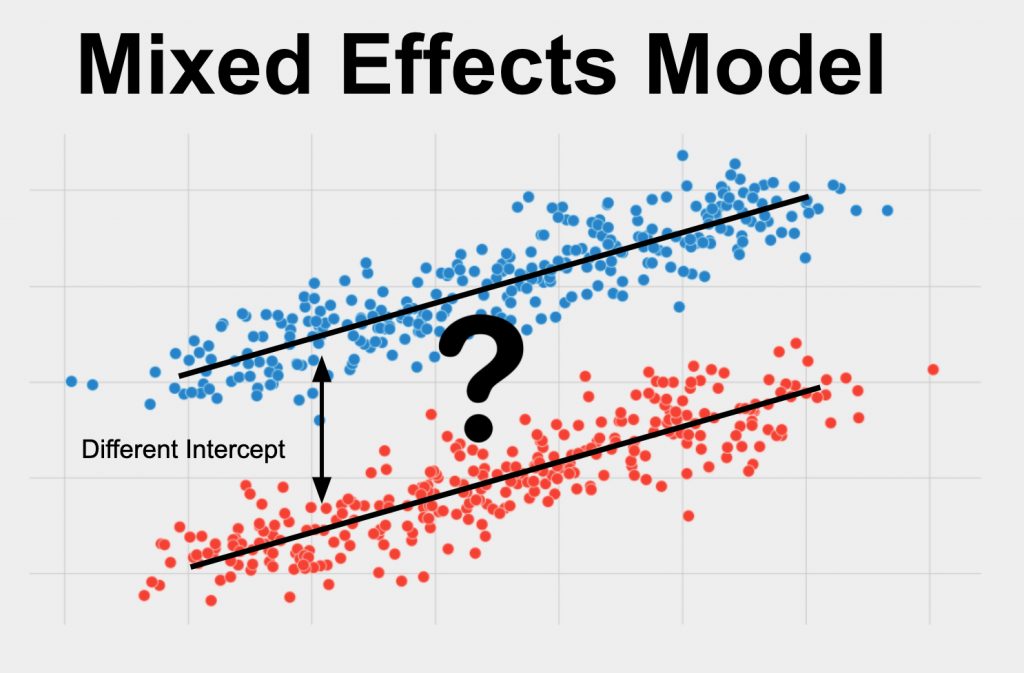
What is a Mixed Effects Model?
A Mixed Effects Model is a statistical test used to predict a single variable using two or more other variables. It also is used to determine the numerical relationship between one variable and others. The variable you want to predict should be continuous and your data should meet the other assumptions listed below.
A Mixed Effects Model is sometimes also called Mixed Effects Regression, Multi-Level Model, Hierarchical Model, or Repeated Measures Linear Regression.
Assumptions for Mixed Effects Modeling
Every statistical method has assumptions. Assumptions mean that your data must satisfy certain properties in order for statistical method results to be accurate.
The assumptions for Mixed Effects Modeling include:
- Linearity
- No Outliers
- Similar Spread across Range
- Normality of Residuals
- No Multicollinearity
Let’s dive in to each one of these separately.
Linearity
The variables that you care about must be related linearly. This means that if you plot the variables, you will be able to draw a straight line that fits the shape of the data.
No Outliers
The variables that you care about must not contain outliers. Linear Regression is sensitive to outliers, or data points that have unusually large or small values. You can tell if your variables have outliers by plotting them and observing if any points are far from all other points.
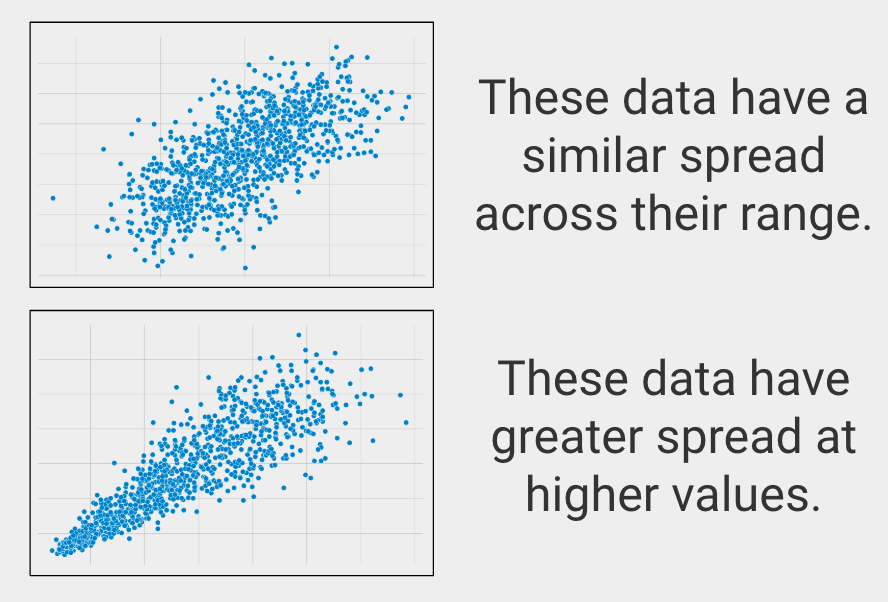
Similar Spread across Range
In statistics this is called homoscedasticity, which describes when variables have a similar spread across their ranges.
Normality of Residuals
The word “residuals” refers to the values resulting from subtracting the expected (or predicted) dependent variables from the actual values. The distribution of these values should match a normal (or bell curve) distribution shape.
Meeting this assumption assures that the results of the regression are equally applicable across the full spread of the data and that there is no systematic bias in the prediction.
No Multicollinearity
Multicollinearity refers to the scenario when two or more of the independent variables are substantially correlated amongst each other. When multicollinearity is present, the regression coefficients and statistical significance become unstable and less trustworthy, though it doesn’t affect how well the model fits the data per se.
When to use a Mixed Effects Model?
You should use a Mixed Effects Model in the following scenario:
- You want to use one variable in a prediction of another, or you want to quantify the numerical relationship between two variables
- The variable you want to predict (your dependent variable) is continuous
- You have more than one independent variable, or one variable that you are using as a predictor
- You have repeated measures from the same unit of observation
Let’s clarify these to help you know when to use a Mixed Effects Model
Prediction
You are looking for a statistical test to predict one variable using another. This is a prediction question. Other types of analyses include examining the strength of the relationship between two variables (correlation) or examining differences between groups (difference).
Continuous Dependent Variable
The variable you want to predict must be continuous. Continuous means that your variable of interest can basically take on any value, such as heart rate, height, weight, number of ice cream bars you can eat in 1 minute, etc.
Types of data that are NOT continuous include ordered data (such as finishing place in a race, best business rankings, etc.), categorical data (gender, eye color, race, etc.), or binary data (purchased the product or not, has the disease or not, etc.).
If your dependent variable is binary, you should use Multiple Logistic Regression, and if your dependent variable is categorical, then you should use Multinomial Logistic Regression or Linear Discriminant Analysis.
More than One Independent Variable
Mixed Effects Models are used when there is one or more predictor variables with multiple values for each unit of observation.
Repeated Measures
This method is suited for the scenario when there are two or more observations for each unit of observation. The unit of observation is what composes a “data point”, for example, a store, a customer, a city, etc…
If you have one or more independent variables but they are measured for the same group at a single point in time, then you should use Multiple Linear Regression.
One Dependent Variable
To run a Mixed Effects Model, you should have only one dependent variable, or variable that you are trying to predict.
If you have more than one variable you are trying to predict at the same time, you should use Multivariate Multiple Linear Regression.
Mixed Effects Model Example
Dependent Variable: Revenue
Independent Variable 1: Advertising Spend by City
Independent Variable 2: City Population
Other Variable: Month (i.e. the above data are collected each month for a year)
The null hypothesis, which is statistical lingo for what would happen if the treatment does nothing, is that there is no relationship between spend on advertising and the advertising dollars or population by city. Our test will assess the likelihood of this hypothesis being true.
We gather our data and after assuring that the assumptions above are met, we perform the analysis.
When we run this analysis, we get a statistic and p-value for each term in the model. One primary output of interest will be Z- or t-statistics and p values for each of the “fixed effects”. In this example, the fixed effects are the effects of Advertising Spend and City Population on Revenue.
The p-value associated with these Z- or t-statistics is the chance of seeing our results assuming there is actually no relationship between that variable and revenue. A p-value less than or equal to 0.05 means that our result is statistically significant and we can trust that the difference is not due to chance alone.
Additional outputs include estimates of intercept and slope for each of our effects. The intercept values represent where the linear regression line crosses the y axis. The slope can be interpreted as follows: for each unit (value of 1) increase in your independent variable, your dependent variable is expected to change by the value of the slope. These intercept and slope values are equivalent to the β0 and β1 values from a typical linear regression.
Frequently Asked Questions
Q: How do I run a Mixed Effects Model in SPSS, R, SAS, or STATA?
A: This resource is focused on helping you pick the right statistical method every time. There are many resources available to help you figure out how to run this method with your data:
SPSS article: https://www.spss.ch/upload/1126184451_Linear%20Mixed%20Effects%20Modeling%20in%20SPSS.pdf
SPSS video: https://www.youtube.com/watch?v=dIv5imb4yqI
R article: https://rstudio-pubs-static.s3.amazonaws.com/63556_e35cc7e2dfb54a5bb551f3fa4b3ec4ae.html
R video: https://www.youtube.com/watch?v=VhMWPkTbXoY
Help!
If you still can’t figure something out, feel free to reach out.