StatsTest Blog
Experimental design, data analysis, and statistical tooling for modern teams. No hype, just the math.
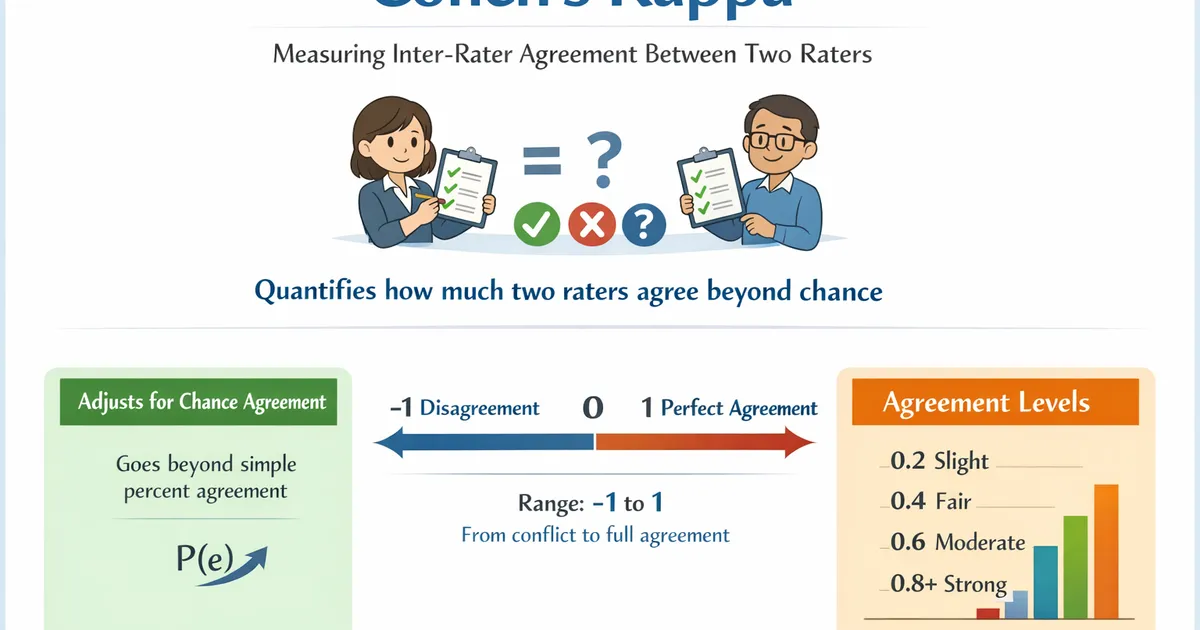
Cohen's Kappa
Cohen's Kappa measures inter-rater agreement between two raters classifying items into categories. Use it to quantify how much two raters agree beyond what would be expected by chance.
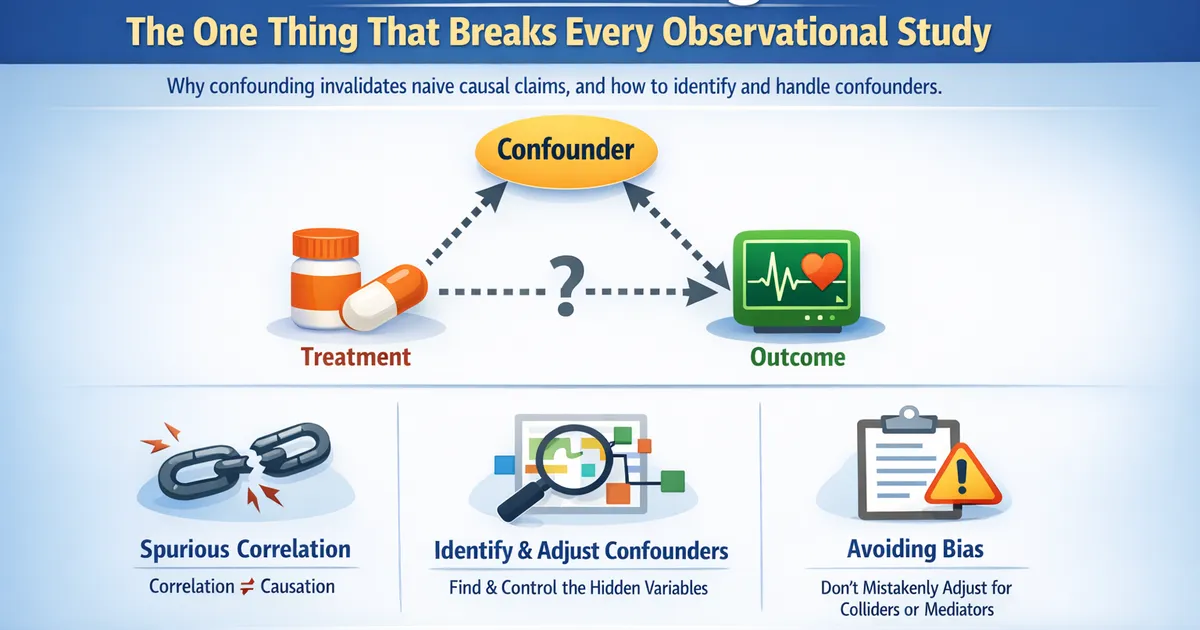
Confounding: The One Thing That Breaks Every Observational Study
What confounding is, why it invalidates naive causal claims, and how to identify and handle confounders in product analytics and observational studies.
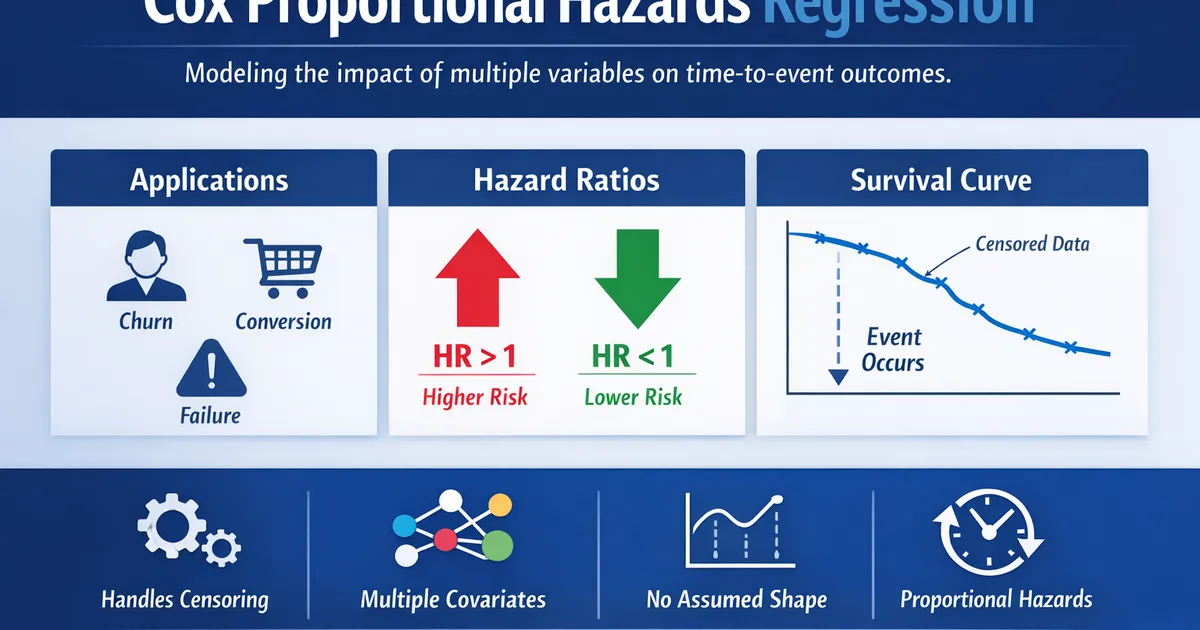
Cox Proportional Hazards Regression
Cox Proportional Hazards Regression models the effect of multiple variables on time-to-event outcomes. Use it to identify which factors accelerate or delay an event such as churn, conversion, or failure.
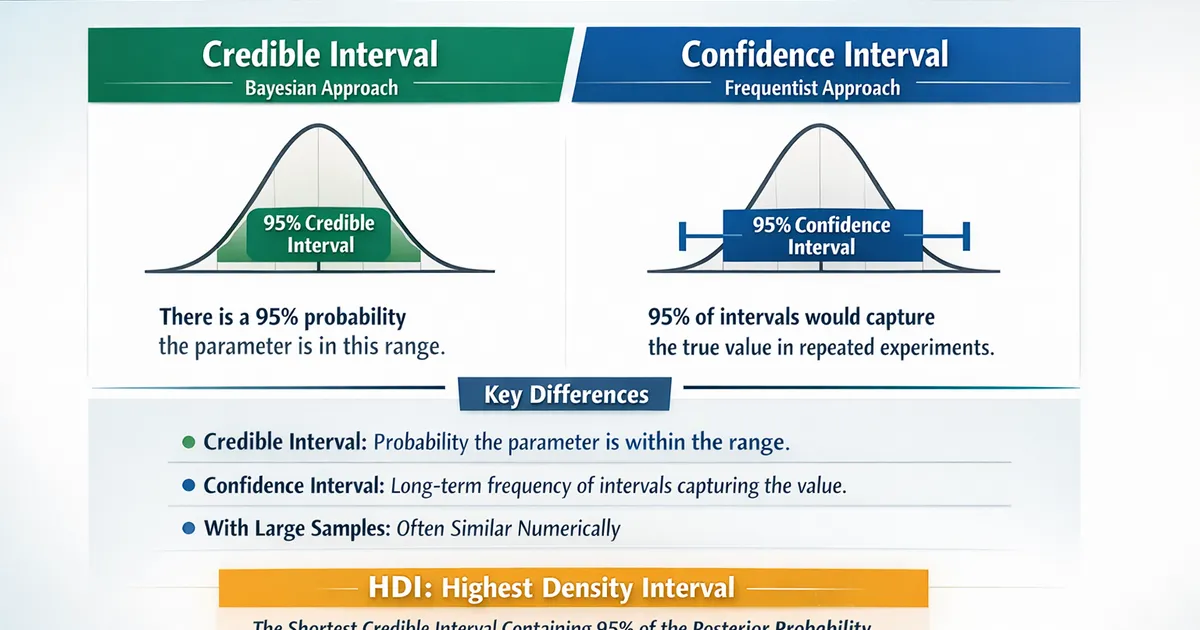
Credible Intervals vs. Confidence Intervals: What Changes
Understand the real difference between credible and confidence intervals. Learn what each actually means, when it matters, and how to interpret both correctly.
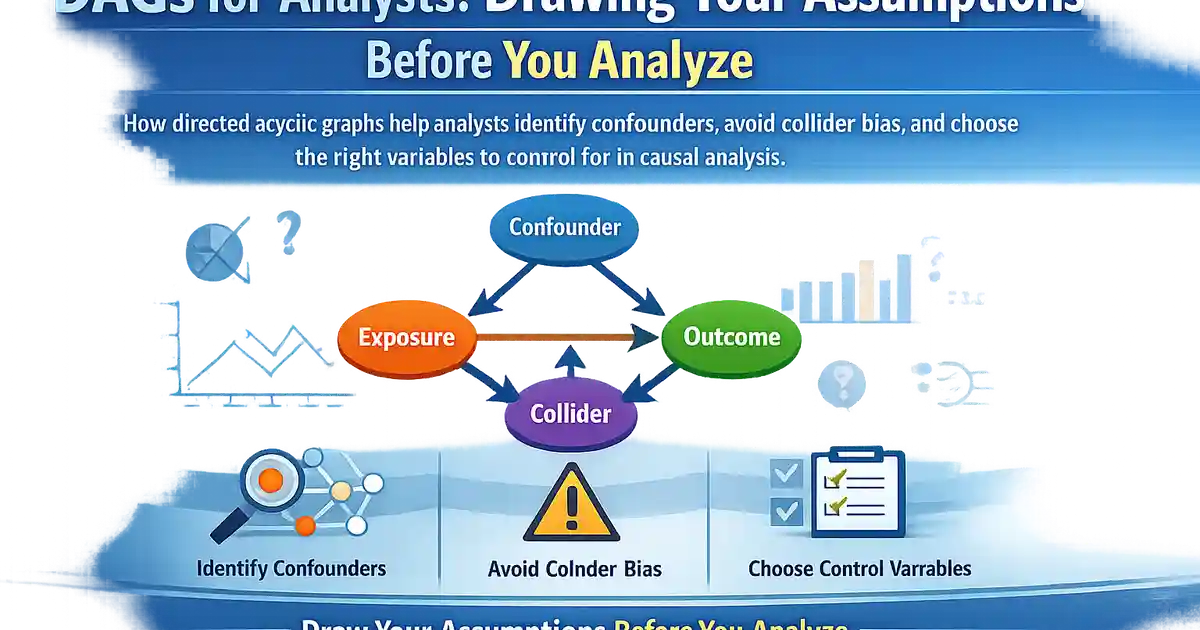
DAGs for Analysts: Drawing Your Assumptions Before You Analyze
How directed acyclic graphs help analysts identify confounders, avoid collider bias, and choose the right variables to control for in causal analysis.
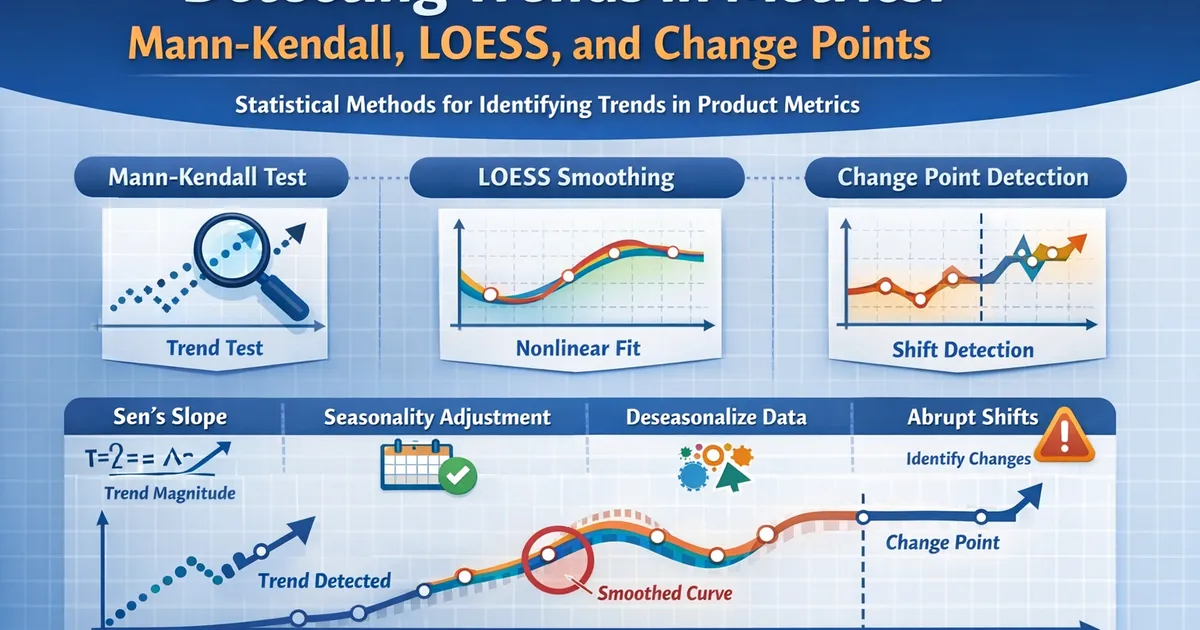
Detecting Trends in Metrics: Mann-Kendall, LOESS, and Change Points
How to statistically detect trends in product metrics using Mann-Kendall tests, LOESS smoothing, and change point analysis.
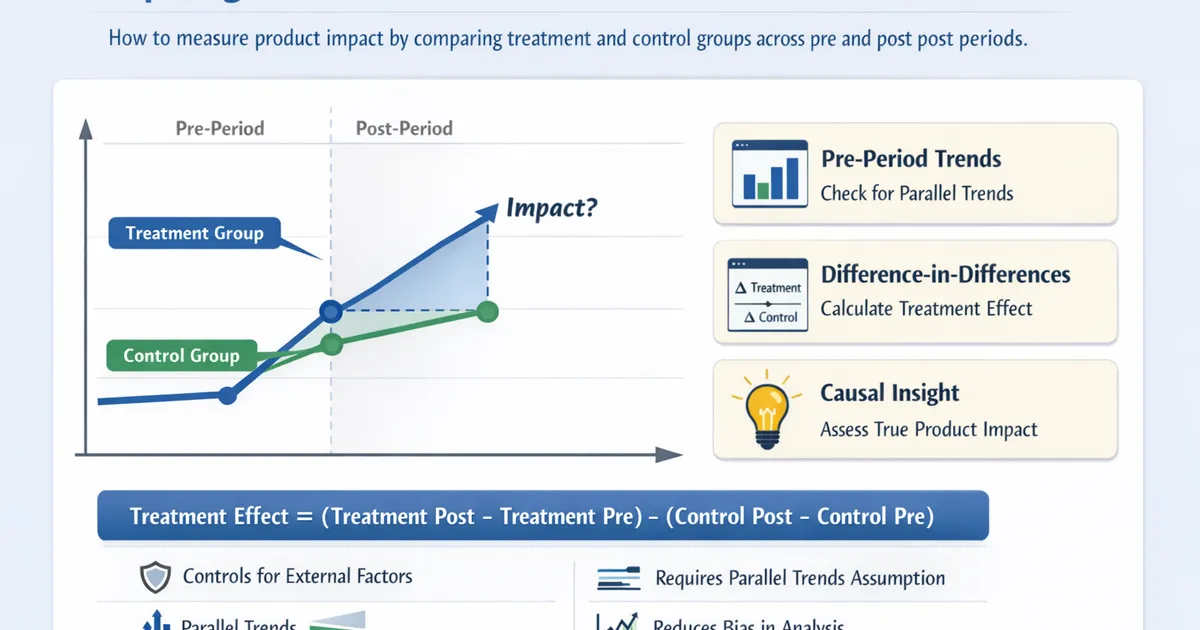
Comparing Pre/Post Periods: Difference-in-Differences for Product
How to use difference-in-differences to measure product impact by comparing treatment and control groups across pre and post periods.
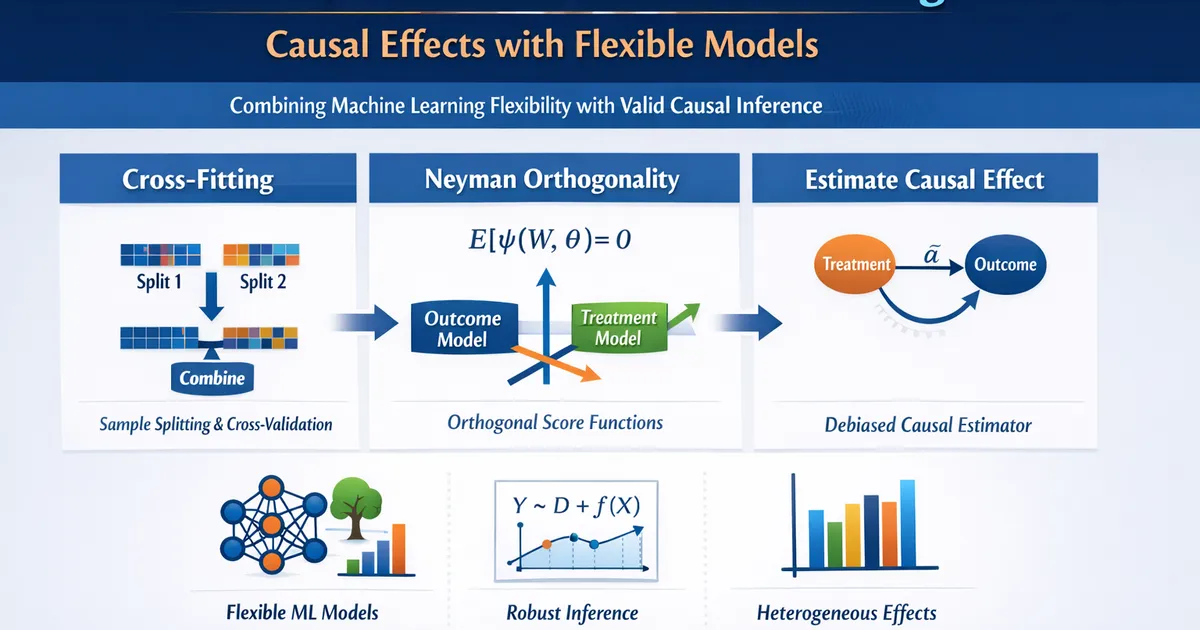
Double/Debiased Machine Learning: Causal Effects with Flexible Models
How double/debiased machine learning combines ML flexibility with valid causal inference. Learn cross-fitting, Neyman orthogonality, and practical DML workflows.
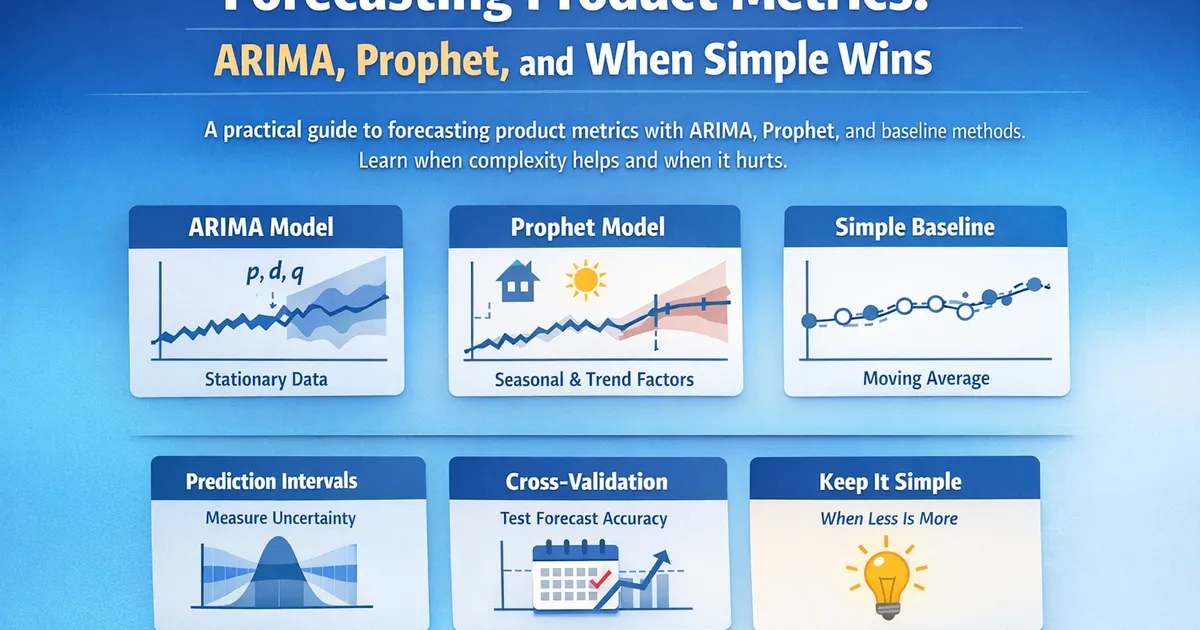
Forecasting Product Metrics: ARIMA, Prophet, and When Simple Wins
A practical guide to forecasting product metrics with ARIMA, Prophet, and baseline methods. Learn when complexity helps and when it hurts.
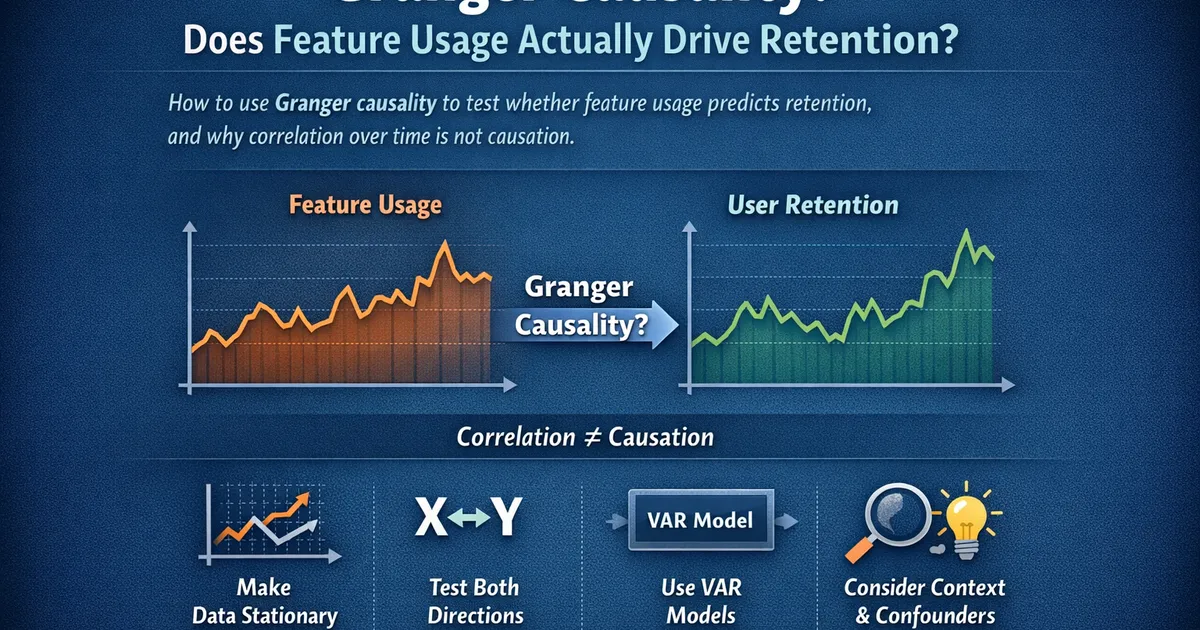
Granger Causality: Does Feature Usage Actually Drive Retention?
How to use Granger causality to test whether feature usage predicts retention, and why correlation over time is not causation.
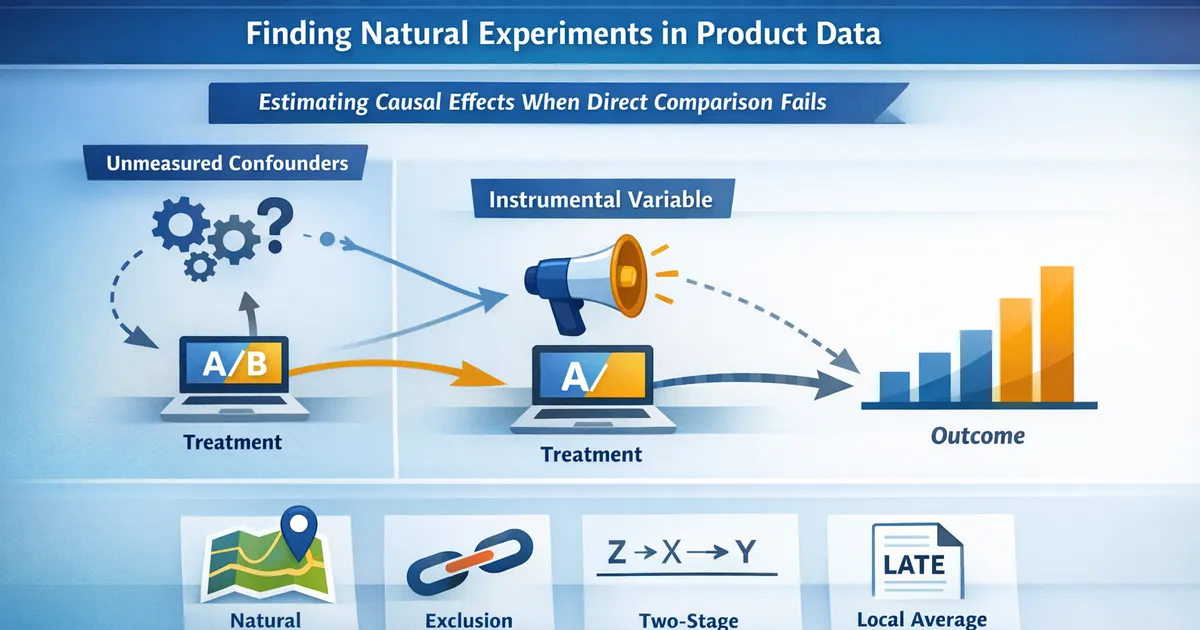
Instrumental Variables: Finding Natural Experiments in Product Data
How instrumental variables let you estimate causal effects when unmeasured confounding makes direct comparison impossible. Practical IV examples for tech.