Contents
DAGs for Analysts: Drawing Your Assumptions Before You Analyze
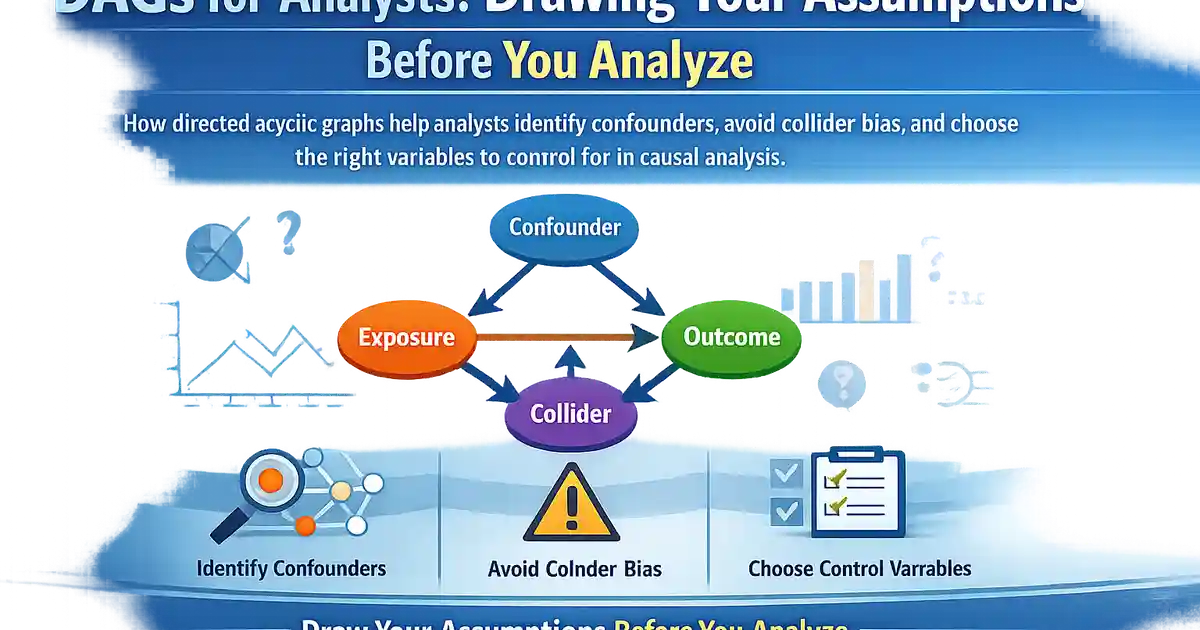
How directed acyclic graphs help analysts identify confounders, avoid collider bias, and choose the right variables to control for in causal analysis.
Quick Hits
- •A DAG is a diagram of your causal assumptions: nodes are variables, directed edges represent causal relationships, and no cycles are allowed
- •DAGs make implicit assumptions explicit, forcing you to commit to a causal story before looking at results
- •The backdoor criterion tells you exactly which variables to adjust for -- and which to leave alone -- to get an unbiased causal estimate
- •Conditioning on a collider (a variable caused by two others) opens a spurious path and creates bias -- one of the most counterintuitive results in statistics
- •You do not need to believe your DAG is perfectly correct; even an approximate DAG is better than no structural thinking at all
TL;DR
Before you run any causal analysis, you should draw a picture. A directed acyclic graph (DAG) maps out your assumptions about which variables cause which. This is not a formality -- it is the step that determines which variables you should control for, which you must leave alone, and whether your causal estimate is identified at all. This post explains how to build a DAG, how to read it, how to apply the backdoor criterion, and how to avoid the collider trap that catches even experienced analysts.
Why You Need a DAG
Every causal analysis makes assumptions about the data-generating process. When you "control for" a variable in a regression, you are making a causal claim: this variable is a confounder that needs to be adjusted for. When you leave a variable out, you are claiming it is either irrelevant or already accounted for.
The problem is that these assumptions are usually implicit. An analyst includes covariates based on habit, availability, or a vague sense that "more controls are better." But controlling for the wrong variable can introduce bias rather than remove it. A DAG makes all of these decisions explicit and auditable.
The payoff:
- A DAG tells you the minimal sufficient set of variables to adjust for.
- It warns you when adjusting for a variable would create bias (collider bias).
- It reveals when causal identification is impossible regardless of your statistical method.
- It facilitates communication: colleagues can critique your assumptions by looking at the graph, not your code.
Building a DAG
Nodes and Edges
- Each node is a variable: treatment, outcome, covariates, unobserved variables.
- Each directed edge (arrow) represents a direct causal effect. means causes .
- No cycles: If causes , cannot cause (at least not in the same time period). This is the "acyclic" constraint.
Steps to Construct a DAG
- Define treatment and outcome. These are the two nodes you care about most.
- List plausible causes of the outcome. What variables affect apart from ?
- List plausible causes of the treatment. What determines who receives ?
- Identify common causes. Variables that cause both and are confounders.
- Add edges based on domain knowledge. Does variable plausibly cause ? If so, draw the arrow.
- Include unobserved variables. If you believe an unmeasured variable exists, include it as a node (often drawn with a dashed circle). This makes the threat explicit.
A Product Analytics Example
You want to estimate the effect of a "power user" badge on purchase frequency.
Nodes: Badge (T), Purchase Frequency (Y), Prior Engagement (C1), Account Age (C2), User Motivation (U, unobserved).
User Motivation (U) --> Prior Engagement (C1)
User Motivation (U) --> Purchase Frequency (Y)
Prior Engagement (C1) --> Badge (T)
Account Age (C2) --> Prior Engagement (C1)
Account Age (C2) --> Purchase Frequency (Y)
Badge (T) --> Purchase Frequency (Y)
This DAG tells you:
- Prior Engagement and Account Age are confounders. They create backdoor paths from Badge to Purchase Frequency.
- User Motivation is an unmeasured confounder. If it exists and is strong, no amount of adjusting for observed variables will fully remove bias.
- You need to adjust for Prior Engagement and Account Age to block the backdoor paths through them.
Reading a DAG: Paths, Blocking, and d-Separation
Paths
A path is any sequence of edges connecting two nodes, regardless of direction. Between and , there may be:
- Causal paths: All edges point from toward (the front-door path). These are the effect you want to measure.
- Backdoor paths: At least one edge points into . These create non-causal associations (confounding).
Blocking a Path
A path is blocked if:
- It contains a non-collider that you condition on (adjust for).
- It contains a collider that you do not condition on (and no descendant of the collider is conditioned on).
d-Separation
Two variables are d-separated (conditionally independent) given a set if every path between them is blocked by . If and are d-separated by on all non-causal paths, then conditioning on removes confounding.
The Backdoor Criterion
Pearl's backdoor criterion provides a testable rule for choosing adjustment sets.
A set satisfies the backdoor criterion relative to treatment and outcome if:
- No variable in is a descendant of .
- blocks every path between and that contains an arrow into .
If you find such a set and can measure all variables in it, you can estimate the causal effect by adjusting for .
Practical tip: Use DAGitty (dagitty.net) to draw your DAG and let the software compute the minimal sufficient adjustment set. This avoids manual errors and handles complex graphs.
The Collider Trap
A collider on a path is a variable where two arrows converge: . On this path, is a collider.
Key rule: Conditioning on a collider opens a path that was previously blocked. This is the opposite of what happens with confounders, and it is deeply counterintuitive.
Example: The Talent-Looks Collider
Suppose being hired at a company () requires either strong talent () or good looks (). Among all people, talent and looks are unrelated. But among employees (conditioning on being hired), a negative association emerges: if someone was hired despite average looks, they must be talented. This is collider bias.
In Product Analytics
Suppose you are studying whether a new recommendation algorithm () improves purchases (). Both the algorithm and inherent user interest () drive clicks (). If you control for clicks (a collider), you create a spurious association between the algorithm and interest, biasing your estimate.
Rule of thumb: Never control for a variable that is a descendant (consequence) of both the treatment and the outcome, unless you have a specific structural reason to do so.
Unobserved Variables and the Limits of DAGs
DAGs include unobserved variables as nodes. An unobserved confounder creates a backdoor path that cannot be blocked by conditioning. When this happens, the DAG tells you that standard adjustment methods are insufficient and you need a different strategy:
- Instrumental variables to bypass unmeasured confounders.
- Regression discontinuity if a threshold exists.
- Sensitivity analysis to bound the bias.
A DAG that shows an unblockable backdoor path is not a failure -- it is an honest assessment that prevents you from producing a biased estimate and calling it causal.
DAGs in Practice: A Workflow
- Before touching data: Convene your team and draw the DAG on a whiteboard. Include treatment, outcome, all plausible confounders, and any unobserved variables.
- Identify adjustment sets. Use the backdoor criterion (manually or with DAGitty) to determine what to control for.
- Check for colliders. Verify that no variable in your adjustment set is a collider or descendant of a collider.
- Assess identification. If an unblockable backdoor path exists, standard adjustment won't work. Consider alternative methods.
- Document the DAG. Include it in your analysis report. Colleagues should be able to see your causal assumptions and critique them.
- Sensitivity analysis. If unobserved confounders are plausible, quantify how much bias they would need to create to change your conclusion.
Common Mistakes
"Kitchen sink" regression. Including every available variable as a control without a DAG. You will almost certainly condition on colliders or mediators, introducing bias.
Confusing prediction with causal inference. A model that predicts well is not the same as a model that estimates the causal effect of on . Good predictors can be colliders or mediators.
Ignoring unobserved variables. A DAG with only observed variables gives false confidence. Include unobserved nodes to represent threats.
Static DAGs for dynamic processes. If variables change over time and cause each other at different time points (time-varying confounding), a standard DAG may not capture the full structure. Consider time-indexed DAGs or causal models for longitudinal data.
Treating the DAG as ground truth. A DAG is a model of your assumptions, not a fact about the world. It can be wrong. But a wrong DAG that you can criticize and improve is better than no DAG and unchecked implicit assumptions.
Summary
DAGs are the single most useful pre-analysis tool for causal inference. They force you to make assumptions explicit, they provide a formal criterion for choosing control variables, and they protect against the counterintuitive trap of collider bias. Drawing a DAG takes 15 minutes. Not drawing one can cost you months of biased analysis.
For the full causal inference toolkit and how each method relates to the DAG framework, see our causal inference overview.
References
- https://ftp.cs.ucla.edu/pub/stat_ser/r350.pdf
- https://www.dagitty.net/
- https://academic.oup.com/ije/article/31/1/163/655748
Frequently Asked Questions
Do I need to know the exact causal structure to draw a DAG?
What software can I use to draw and analyze DAGs?
How do I know if I should include a variable as a node in my DAG?
Key Takeaway
DAGs are the essential pre-analysis step for any causal inference study. They force you to state your causal assumptions explicitly, reveal which variables to adjust for, and protect against the counterintuitive pitfall of collider bias.