StatsTest Blog
Experimental design, data analysis, and statistical tooling for modern teams. No hype, just the math.
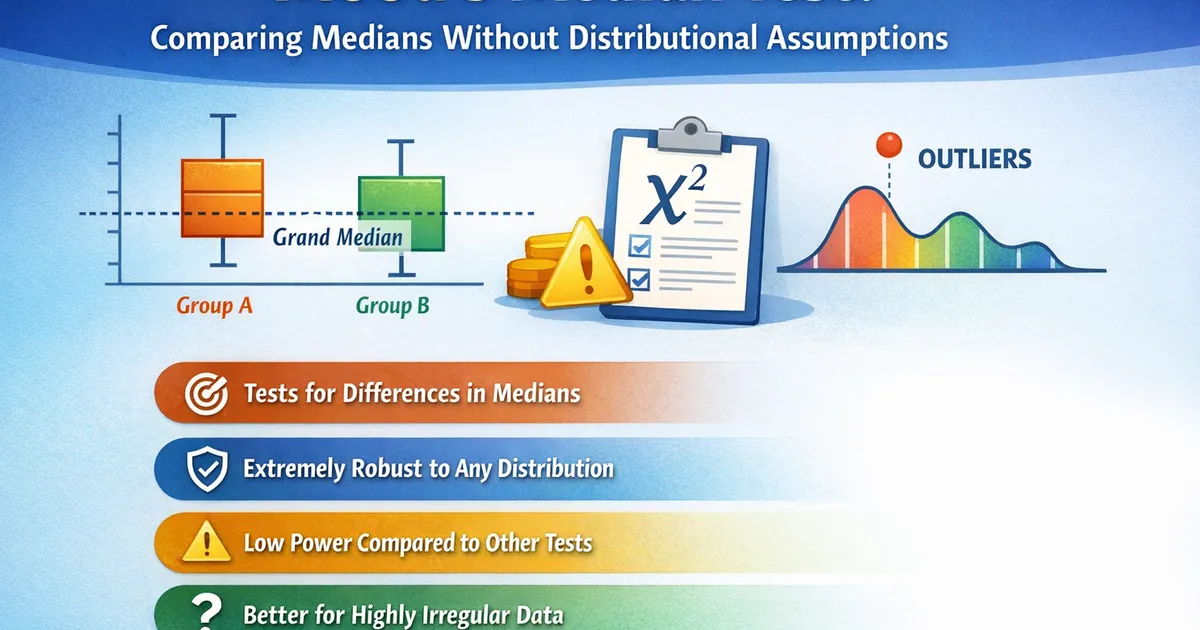
Mood's Median Test: Comparing Medians Without Distributional Assumptions
Mood's median test compares medians across two or more groups with minimal assumptions. Learn when it beats Mann-Whitney, its limitations, and better alternatives.
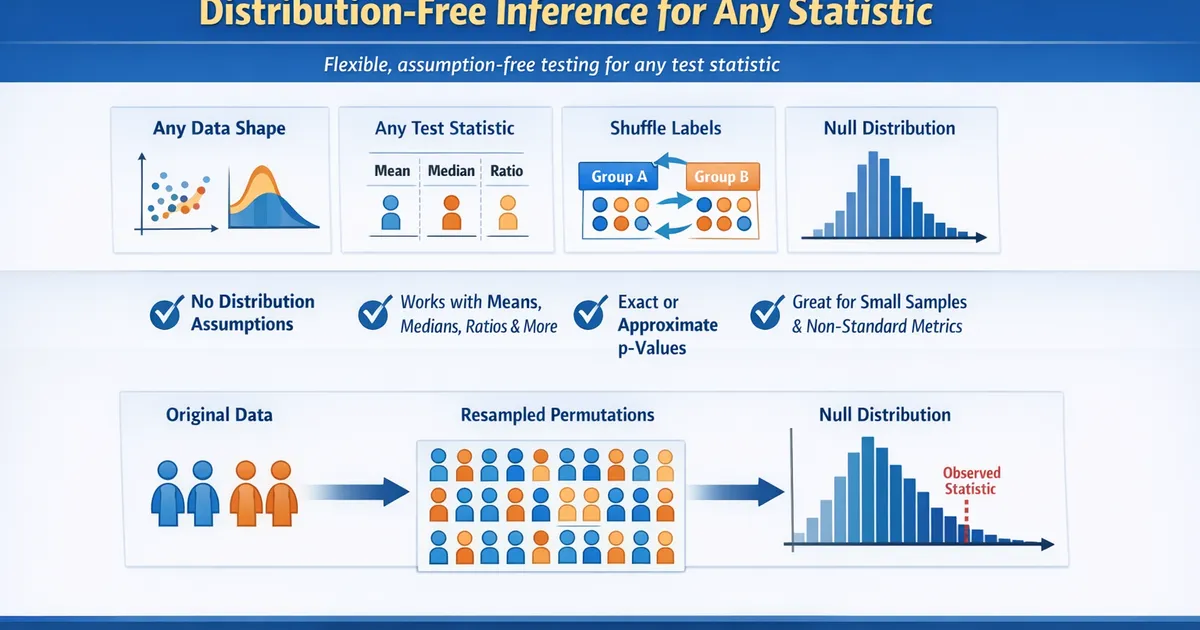
Permutation Tests: Distribution-Free Inference for Any Statistic
Permutation tests make no distributional assumptions and work with any test statistic. Learn when they beat parametric tests, how they work, and practical implementation tips.
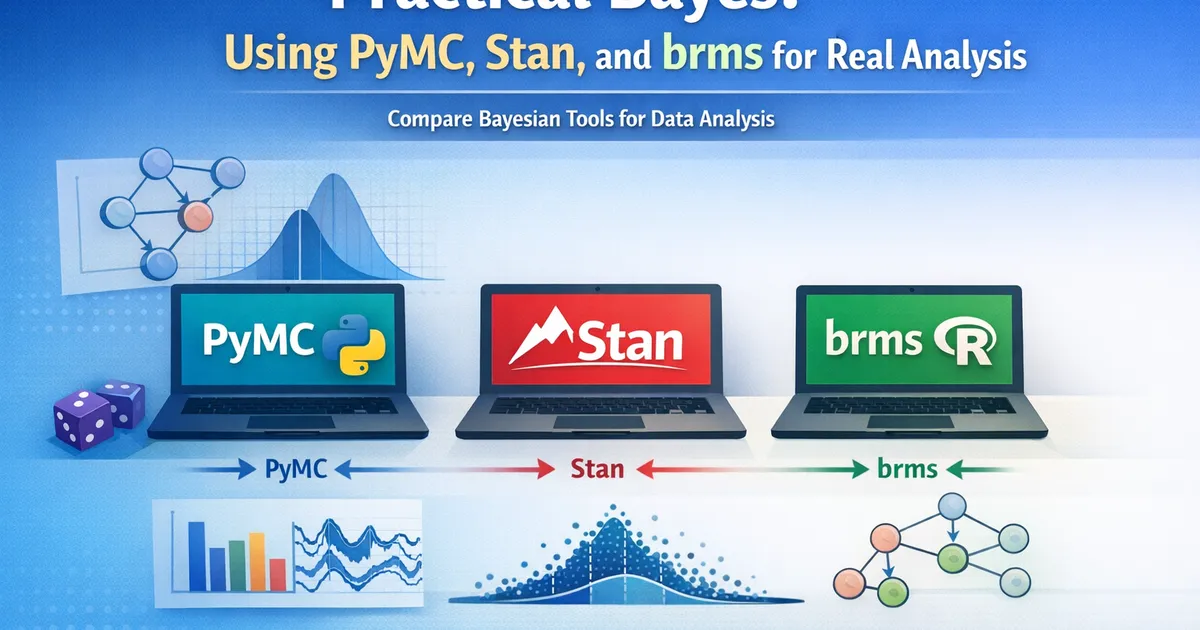
Practical Bayes: Using PyMC, Stan, and brms for Real Analysis
Hands-on guide to Bayesian tools. Compare PyMC, Stan, and brms with real examples. Learn which tool fits your workflow and how to get started fast.
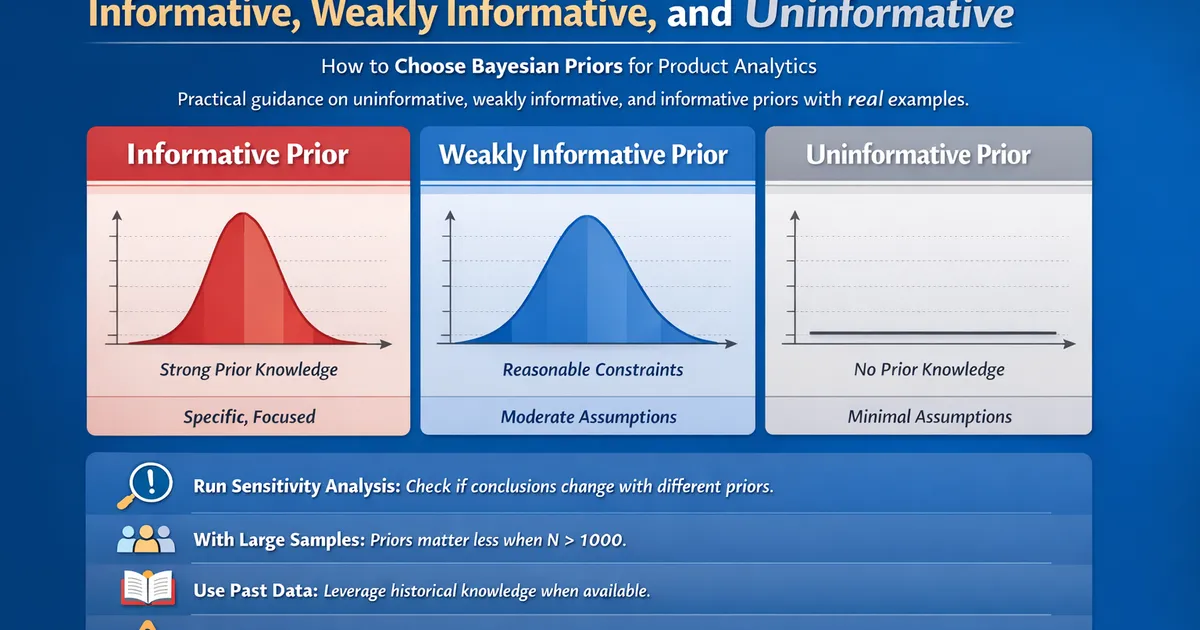
Prior Selection: Informative, Weakly Informative, and Uninformative
How to choose Bayesian priors for product analytics. Practical guidance on uninformative, weakly informative, and informative priors with real examples.
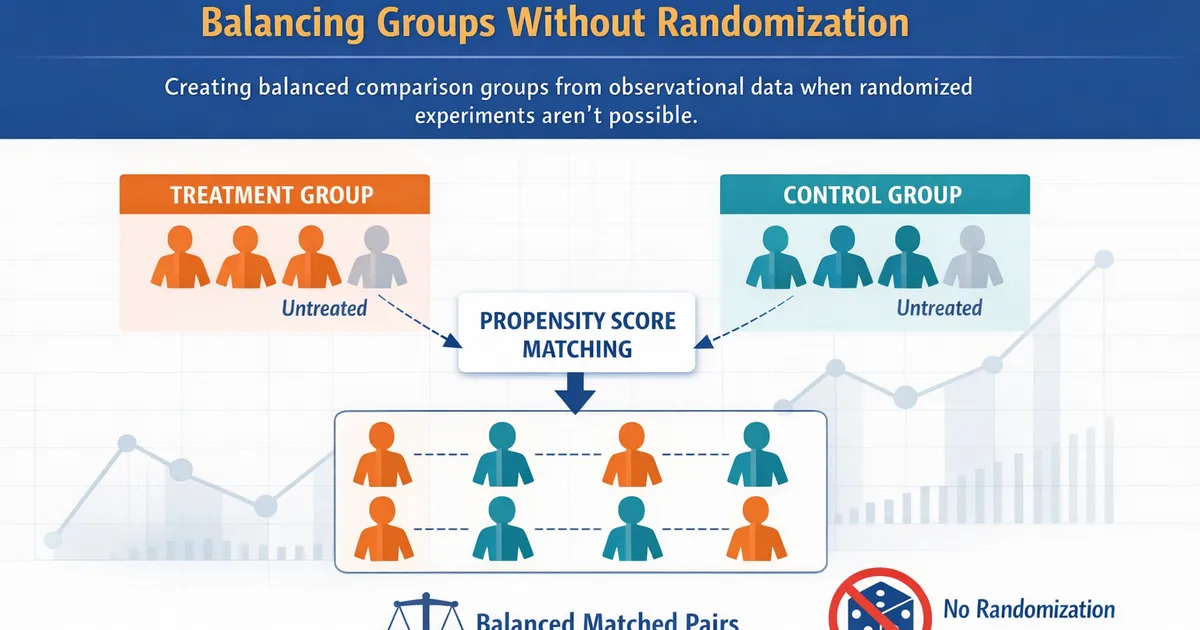
Propensity Score Matching: Balancing Groups Without Randomization
Learn how propensity score matching creates balanced comparison groups from observational data when randomized experiments aren't possible.
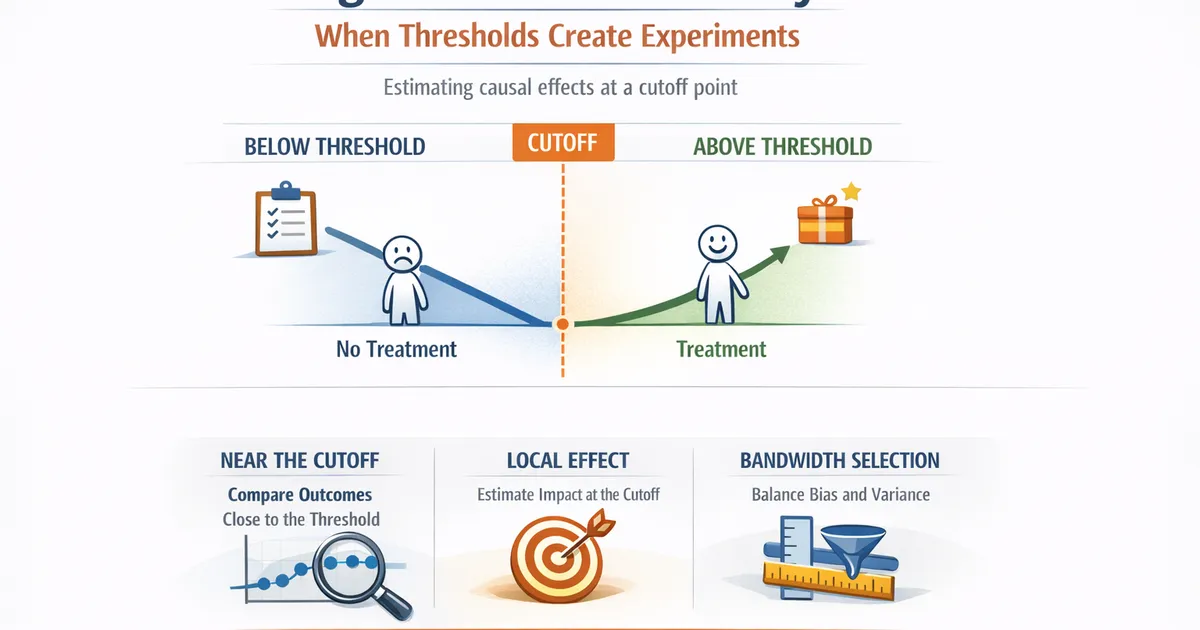
Regression Discontinuity: When Thresholds Create Experiments
How regression discontinuity designs exploit score cutoffs to estimate causal effects. A practical guide for product analysts with real-world examples.
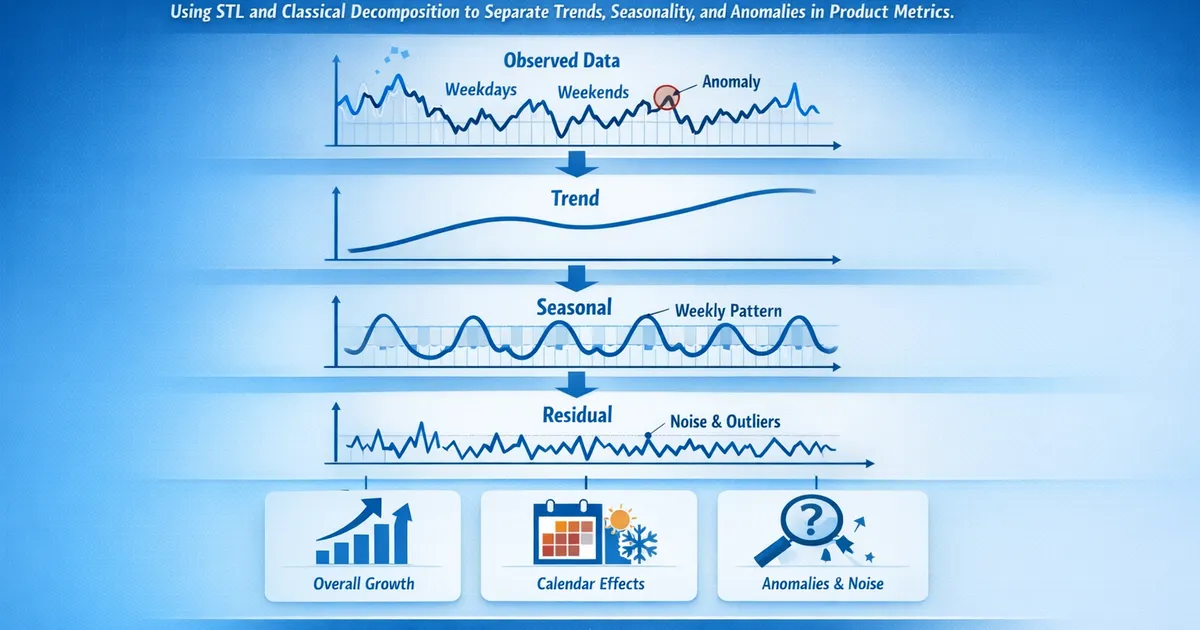
Seasonal Decomposition: Separating Signal from Calendar Effects
How to use STL and classical decomposition to separate trends, seasonality, and anomalies in product metrics.
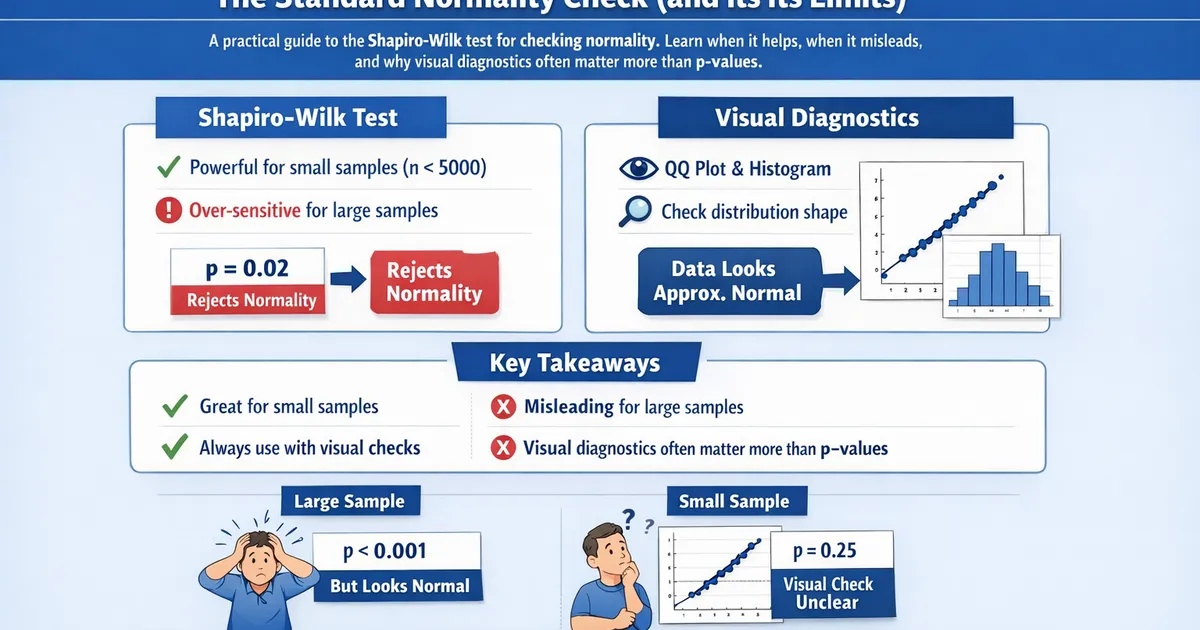
Shapiro-Wilk Test: The Standard Normality Check (and Its Limits)
A practical guide to the Shapiro-Wilk test for checking normality. Learn when it helps, when it misleads, and why visual diagnostics often matter more than p-values.
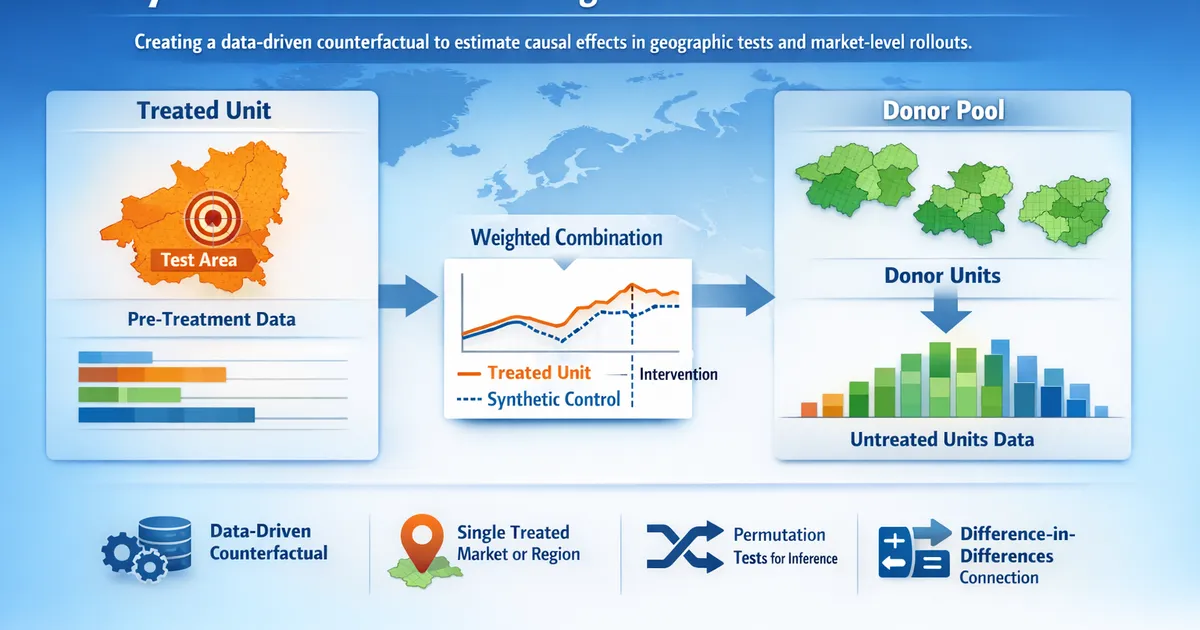
Synthetic Control: Building a Counterfactual for Geo Tests
How the synthetic control method builds a data-driven counterfactual from donor units to estimate causal effects in geo tests and market-level rollouts.
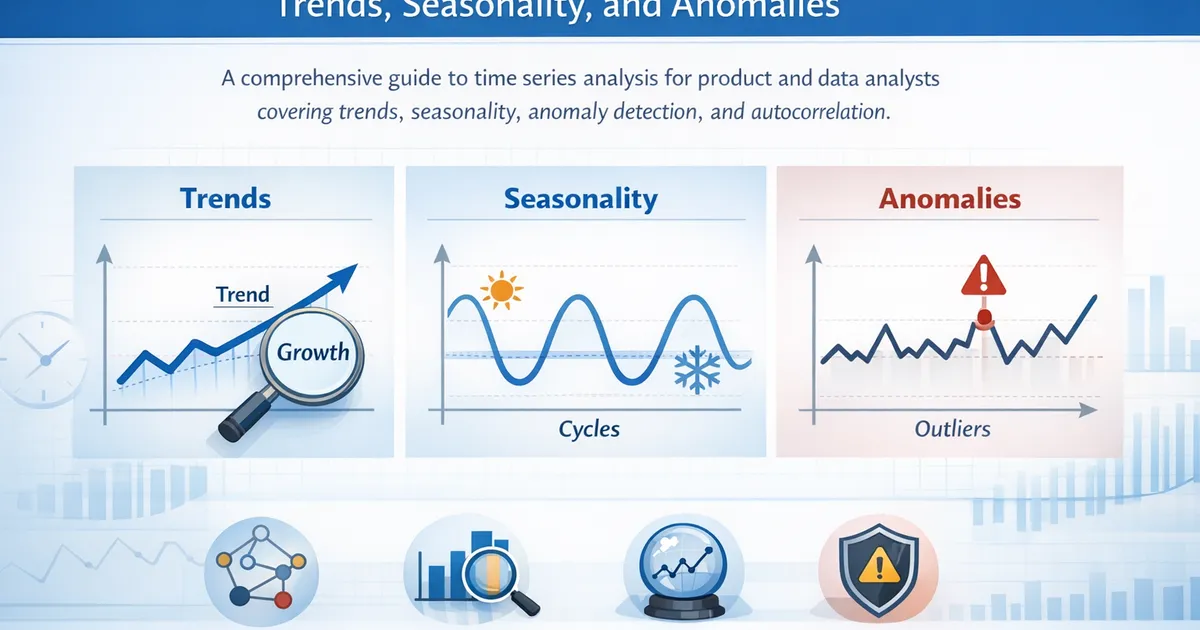
Time Series Analysis for Product Metrics: Trends, Seasonality, and Anomalies
A comprehensive guide to time series analysis for product and data analysts covering trends, seasonality, anomaly detection, and autocorrelation.
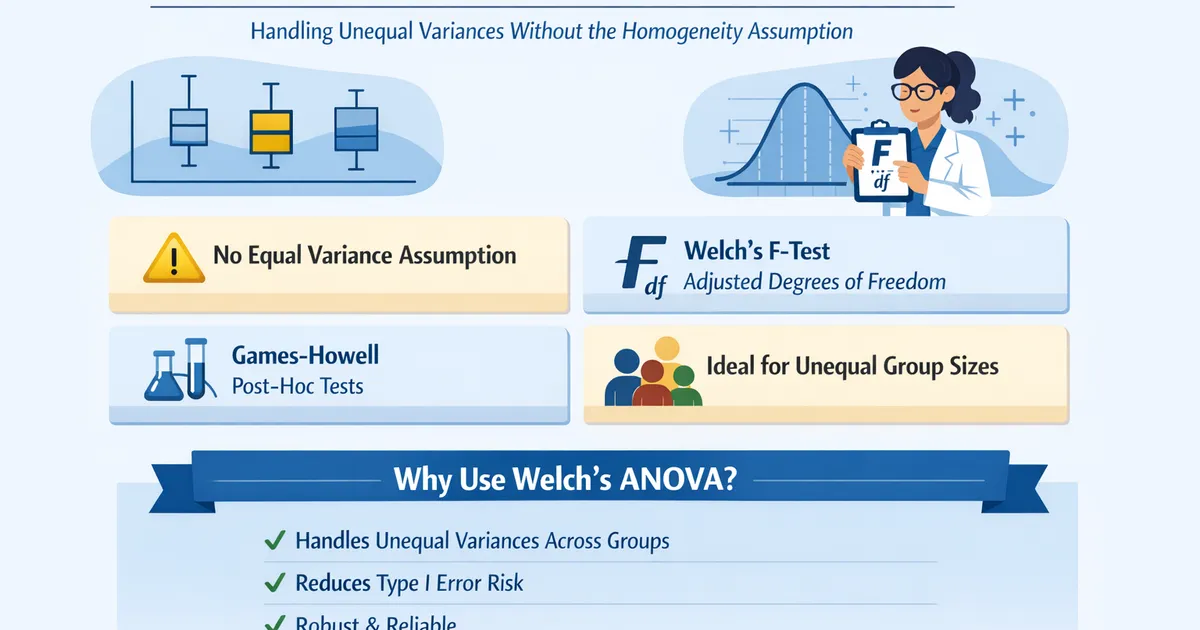
Welch's ANOVA: When Group Variances Differ
Welch's ANOVA handles unequal variances across groups without requiring the homogeneity assumption. Learn when to use it instead of standard one-way ANOVA and how to follow up.
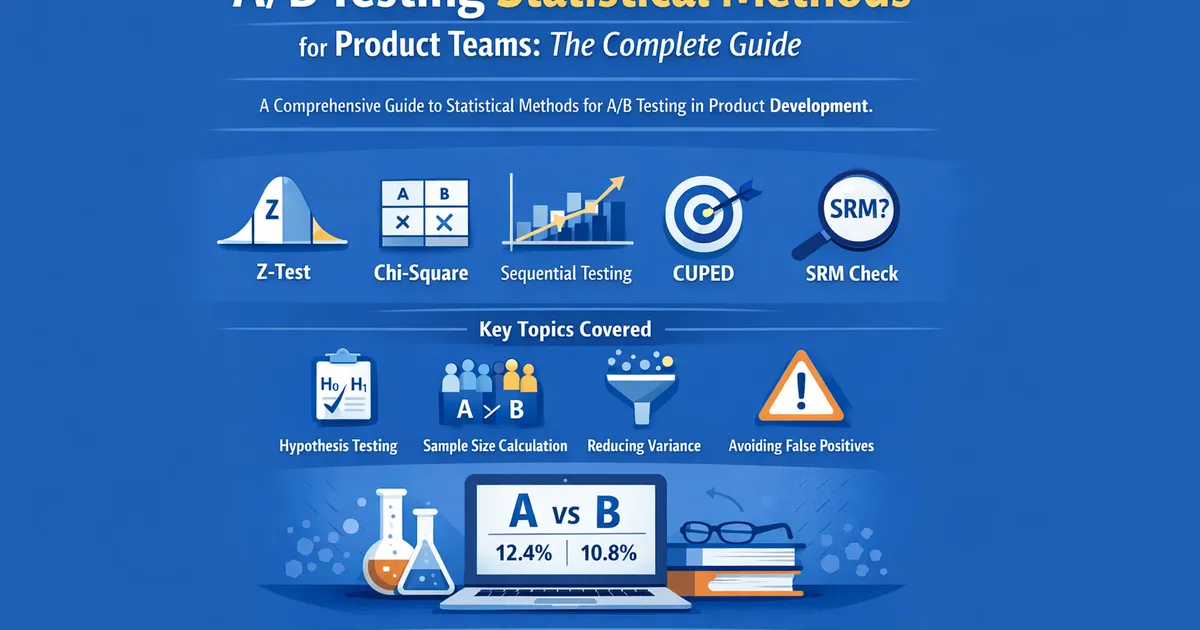
A/B Testing Statistical Methods for Product Teams: The Complete Guide
A comprehensive guide to statistical methods for A/B testing in product development. Learn when to use z-tests, chi-square, sequential testing, CUPED, and how to handle the real-world messiness of experimentation.