Contents
Permutation Tests: Distribution-Free Inference for Any Statistic
Permutation tests make no distributional assumptions and work with any test statistic. Learn when they beat parametric tests, how they work, and practical implementation tips.
Quick Hits
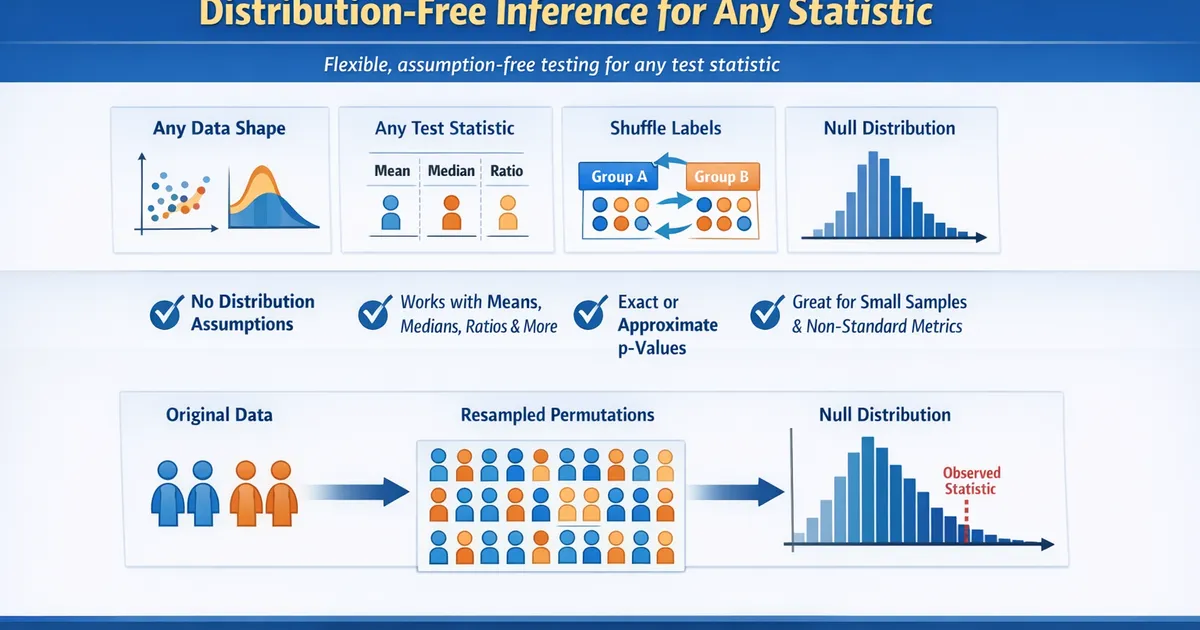
- •No distributional assumptions: works with any data shape
- •Works with any test statistic: means, medians, ratios, custom metrics
- •Exact p-values for small samples; approximate for large ones
- •Null distribution is constructed by shuffling group labels
- •Especially useful for complex or non-standard test statistics
Permutation tests (also called randomization tests or exact tests) are a powerful non-parametric approach that constructs the null distribution by shuffling the data itself.
How Permutation Tests Work
- Compute the observed test statistic (e.g., difference in means between Group A and Group B)
- Pool all observations and randomly reassign them to groups (permute the group labels)
- Recompute the test statistic for each permutation
- Repeat thousands of times to build a null distribution
- Calculate p-value: proportion of permuted statistics as extreme as the observed one
The logic: if the groups are truly interchangeable (null hypothesis), then shuffling labels should produce test statistics similar to the observed one. If the observed statistic is extreme relative to the permutation distribution, the null is rejected.
When Permutation Tests Shine
- Non-standard statistics: Testing a difference in medians, a ratio of means, a trimmed mean, or any custom metric
- Small samples: No reliance on asymptotic approximations
- Non-normal data: No distributional assumptions whatsoever
- Teaching: The logic is intuitive and easy to explain
Practical Considerations
Speed: With modern computers, 10,000 permutations run in milliseconds for most datasets. For very large datasets, use approximate methods.
One-sample and paired tests: Permute signs (multiply each observation by +1 or -1 randomly) instead of shuffling group labels.
Multiple variables: Permutation tests generalize to multivariate settings and ANOVA-like designs.
Example
You compare the median time-on-task between two prototype designs. Medians: Design A = 45s, Design B = 38s. Difference = 7s. Sample: 15 users per group.
With n=15 per group, a t-test on medians is unreliable. A permutation test shuffles the 30 observations between groups 10,000 times, computing the median difference each time. Only 3.2% of permutations produce a difference as large as 7s, giving p = 0.032. The difference is significant.
See also: Bootstrap Confidence Intervals for Difference in Means for estimation rather than hypothesis testing.
References
- https://www.jwilber.me/permutationtest/
- https://www.ncbi.nlm.nih.gov/pmc/articles/PMC4175414/
Frequently Asked Questions
How is a permutation test different from a bootstrap test?
How many permutations do I need?
When should I use a permutation test instead of a t-test?
Key Takeaway
Permutation tests are the most general-purpose hypothesis testing framework. They make no distributional assumptions and work with any test statistic. They are especially valuable for non-standard metrics, small samples, and situations where parametric assumptions are questionable.