StatsTest Blog
Experimental design, data analysis, and statistical tooling for modern teams. No hype, just the math.
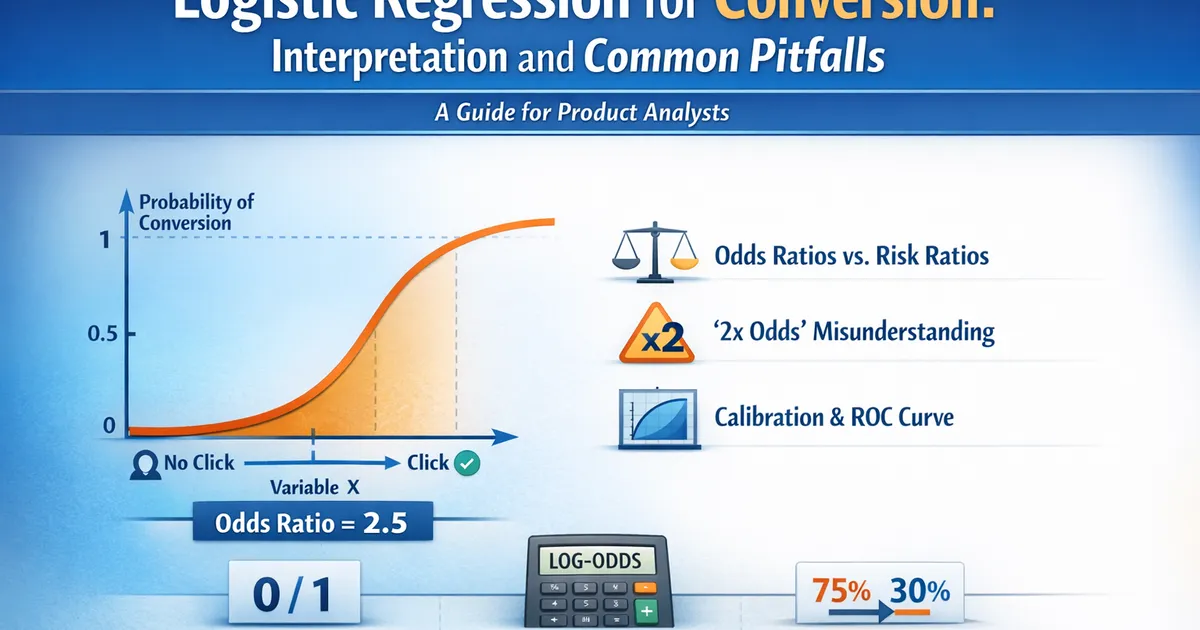
Logistic Regression for Conversion: Interpretation and Common Pitfalls
A practical guide to logistic regression for product analysts. Learn to interpret odds ratios correctly, avoid common mistakes, and communicate results to stakeholders who don't think in log-odds.
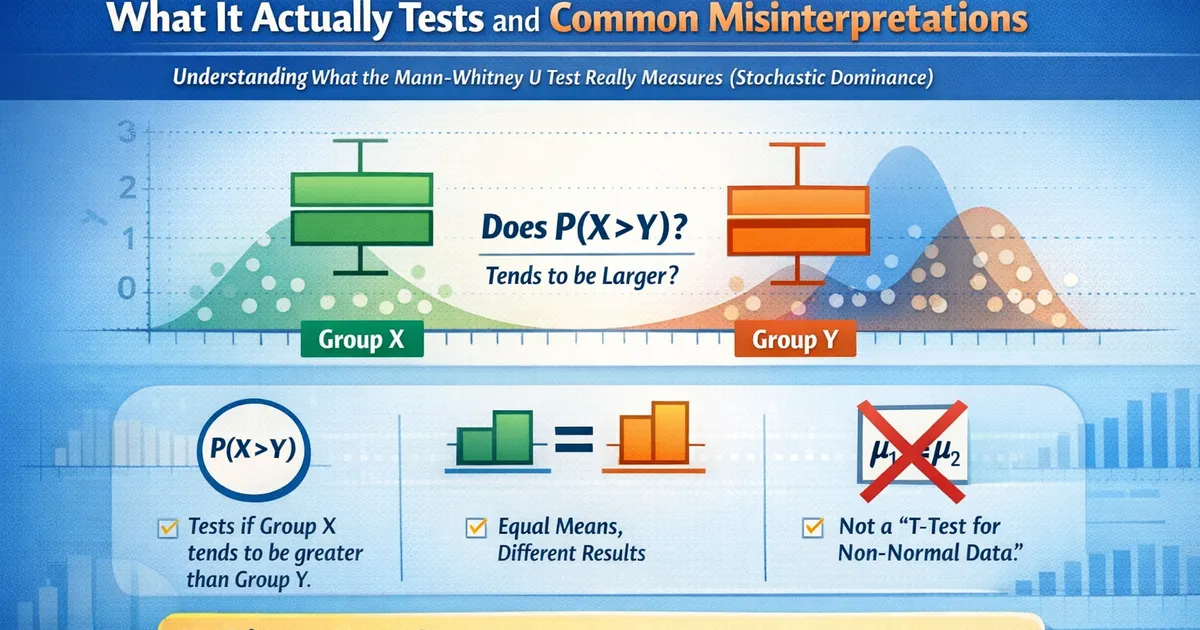
Mann-Whitney U Test: What It Actually Tests and Common Misinterpretations
The Mann-Whitney U test is widely misunderstood. Learn what it actually tests (stochastic dominance), when it's appropriate, and why it's not always a substitute for the t-test.
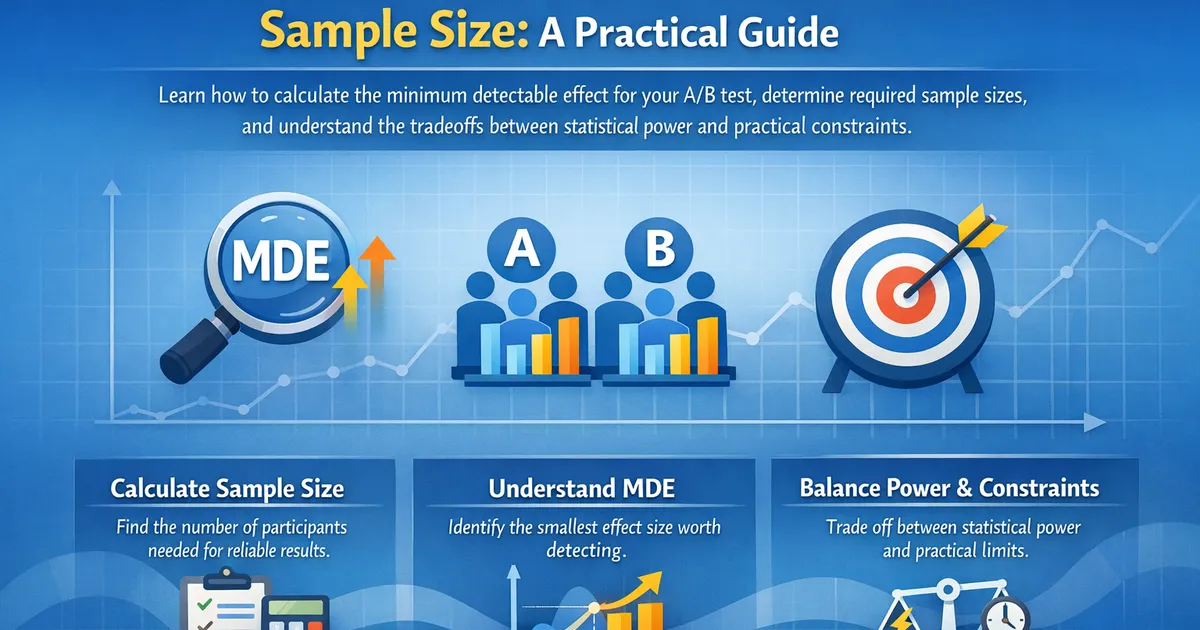
Minimum Detectable Effect and Sample Size: A Practical Guide
Learn how to calculate the minimum detectable effect for your A/B test, determine required sample sizes, and understand the tradeoffs between statistical power and practical constraints.
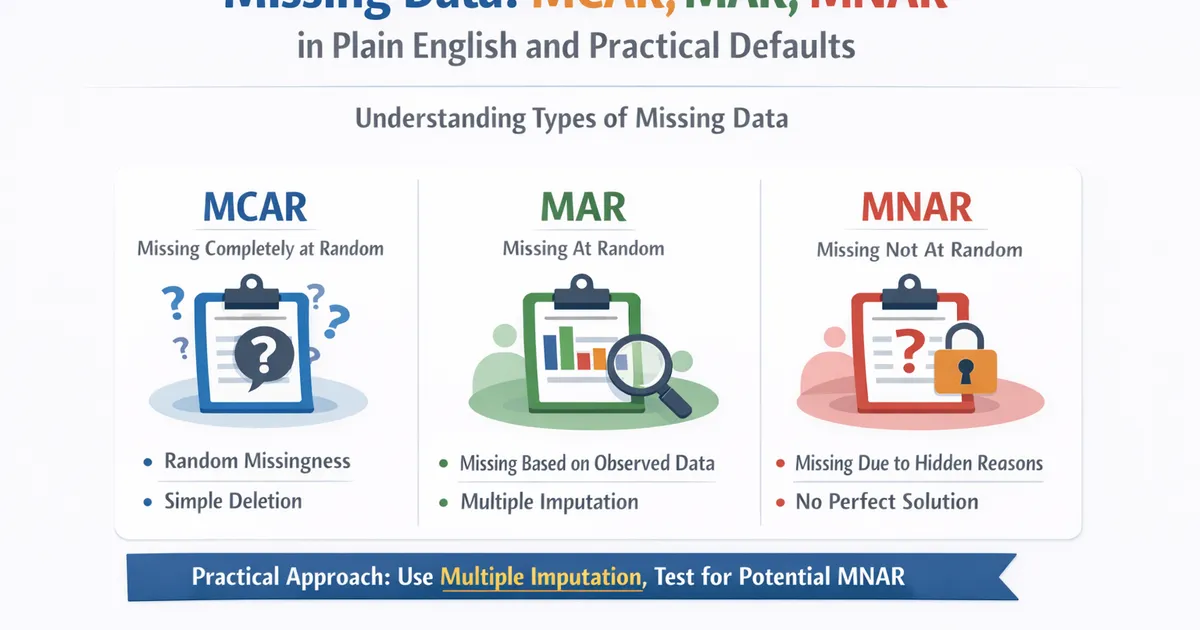
Missing Data: MCAR, MAR, MNAR in Plain English and Practical Defaults
A practical guide to handling missing data. Learn the three types of missingness, why it matters for your analysis, and sensible default approaches for product analytics.
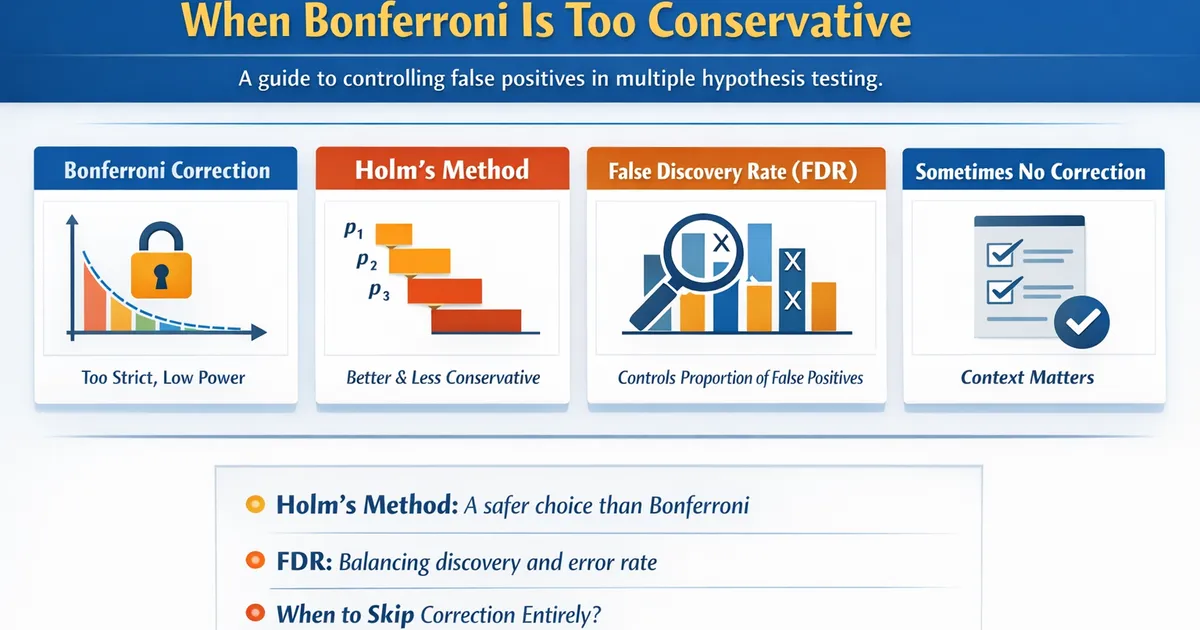
Multiple Comparisons: When Bonferroni Is Too Conservative
A practical guide to controlling false positives when testing multiple hypotheses. Learn when Bonferroni over-corrects and better alternatives like Holm, FDR, and when to skip correction entirely.
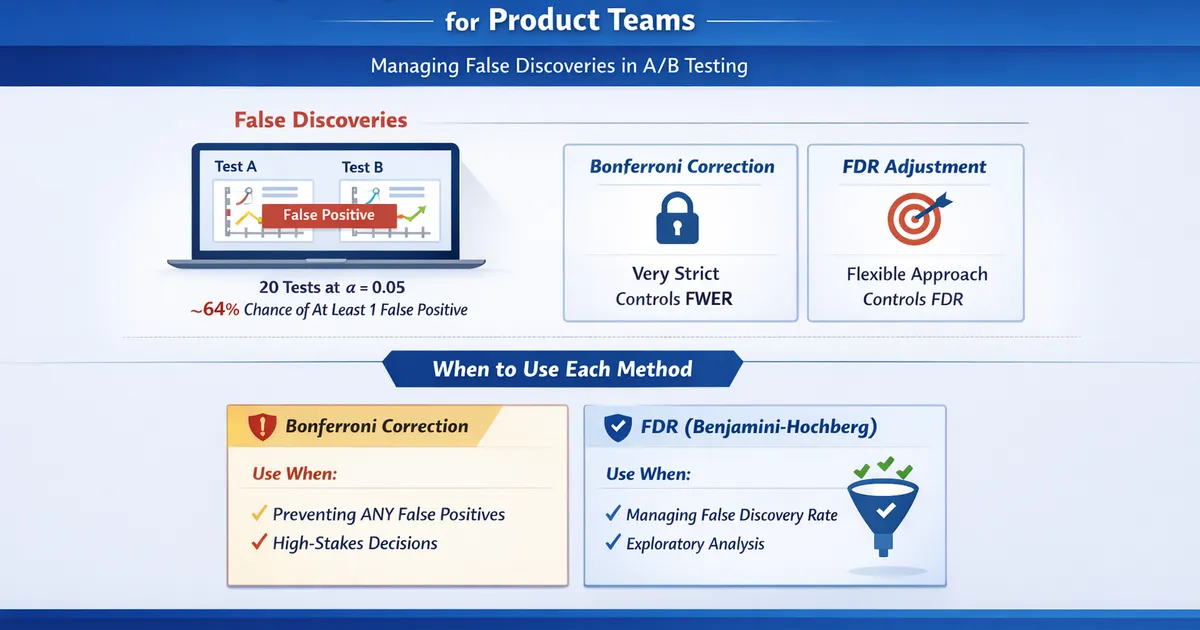
Multiple Experiments: FDR vs. Bonferroni for Product Teams
How to manage false discoveries when running many A/B tests simultaneously. Learn when to use Bonferroni, Benjamini-Hochberg FDR, and when corrections aren't needed.
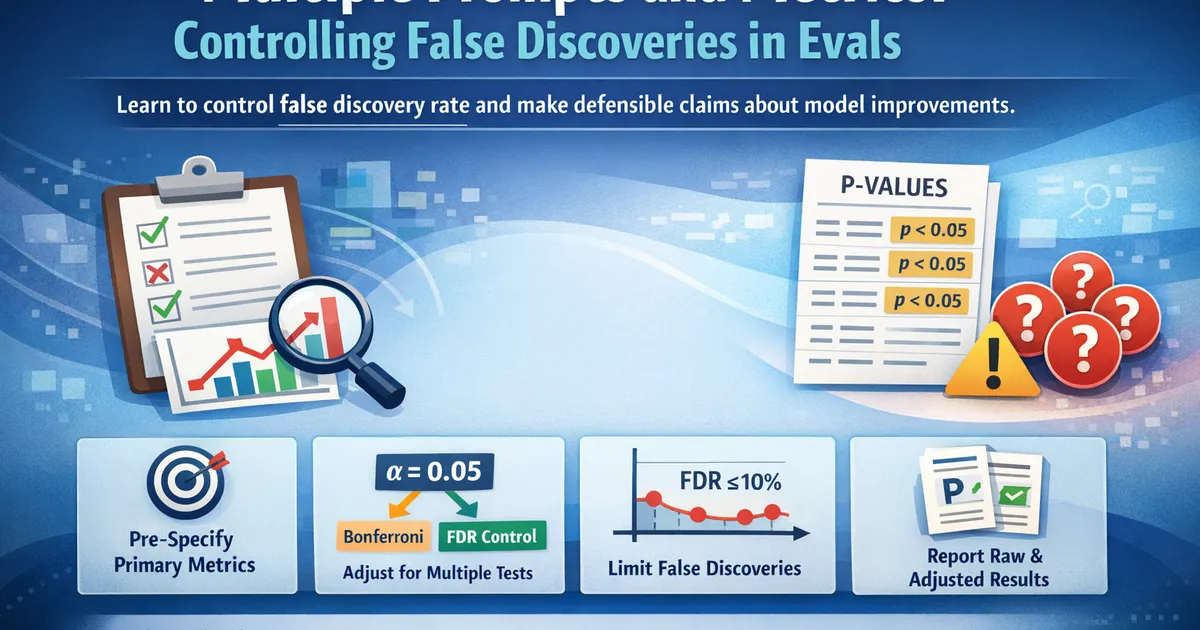
Multiple Prompts and Metrics: Controlling False Discoveries in Evals
When evaluating models across many prompts or metrics, false positives multiply. Learn how to control false discovery rate and make defensible claims about model improvements.
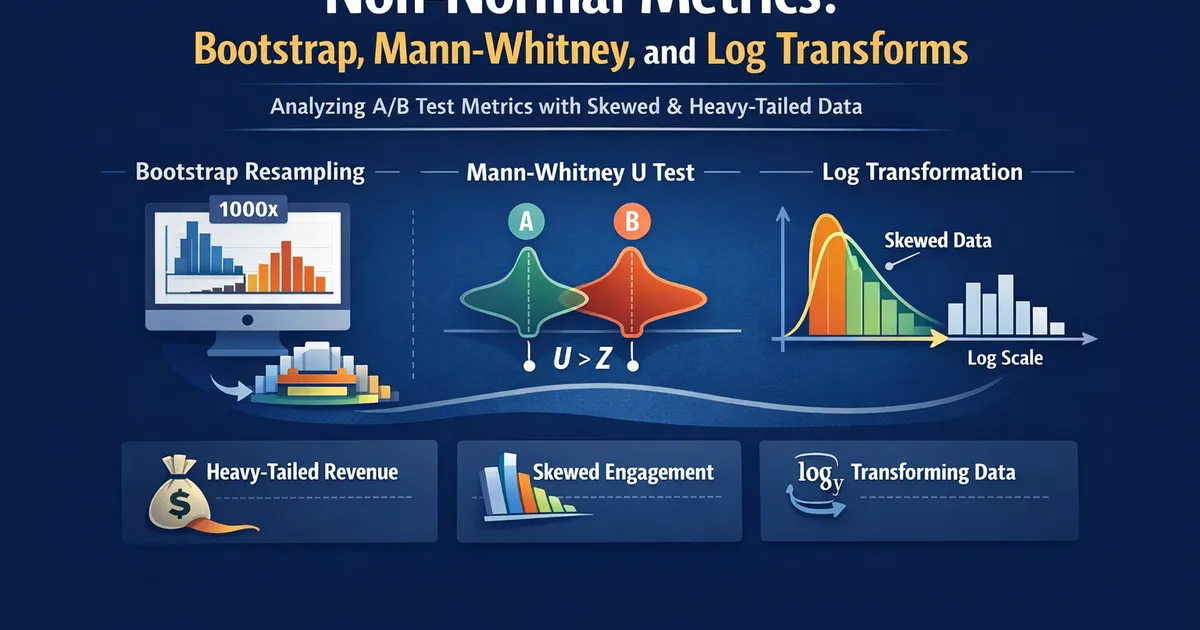
Non-Normal Metrics: Bootstrap, Mann-Whitney, and Log Transforms
How to analyze A/B test metrics that aren't normally distributed—heavy-tailed revenue, skewed engagement, and other messy real-world data. Covers bootstrap methods, Mann-Whitney U, and when transformations help.
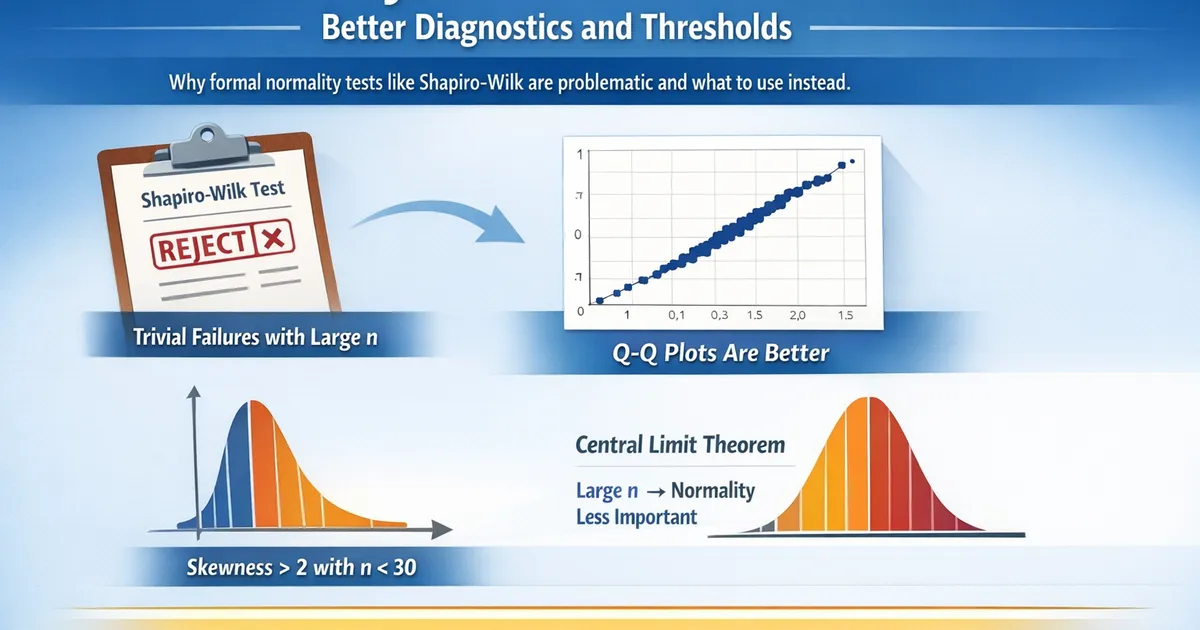
Normality Tests Are Overrated: Better Diagnostics and Thresholds
Why formal normality tests like Shapiro-Wilk are problematic and what to use instead. Learn practical thresholds for when non-normality actually matters.
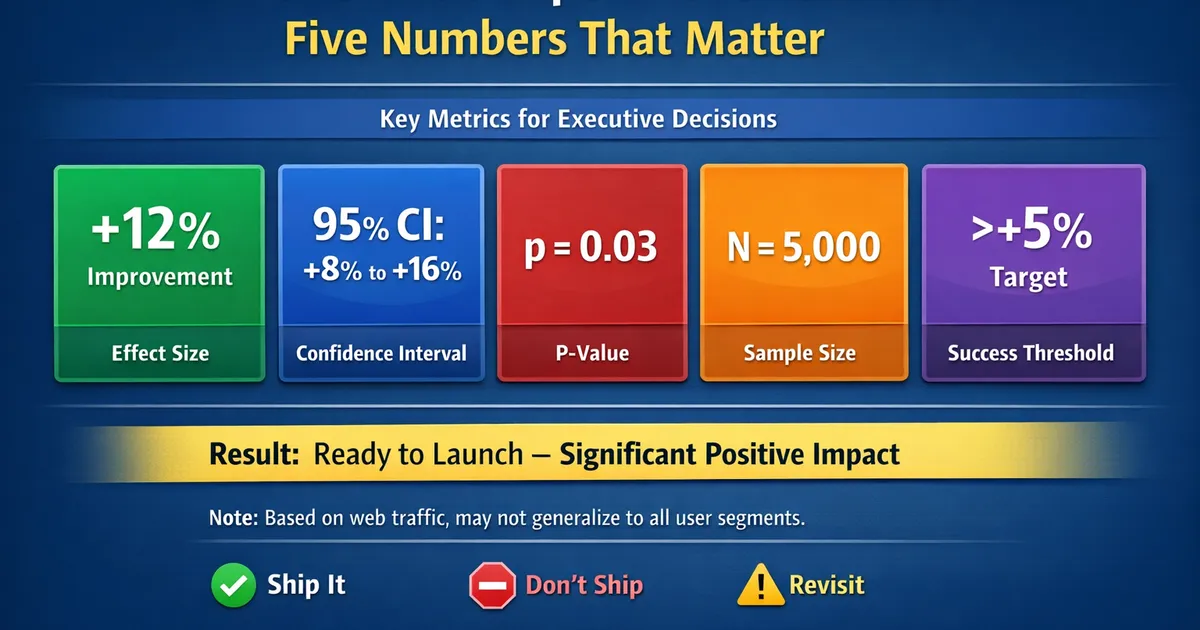
The One-Slide Experiment Readout: Five Numbers That Matter
A template for presenting experiment results in one slide. Focus on the five numbers executives actually need to make a decision.
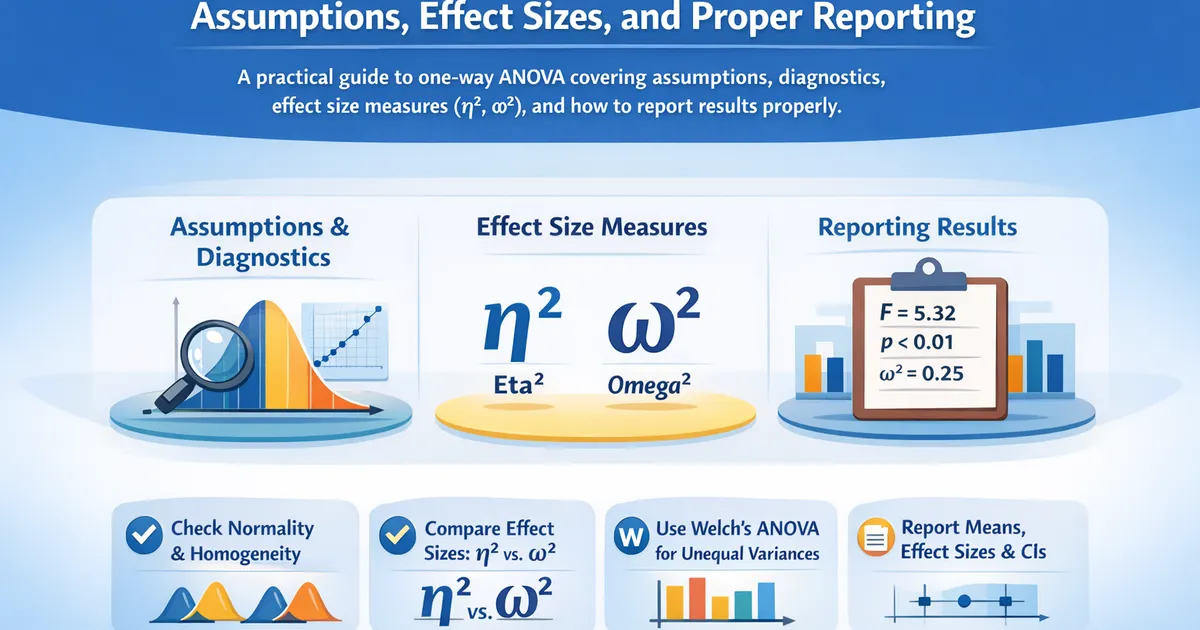
One-Way ANOVA: Assumptions, Effect Sizes, and Proper Reporting
A practical guide to one-way ANOVA covering assumptions, diagnostics, effect size measures (eta-squared, omega-squared), and how to report results properly.