Contents
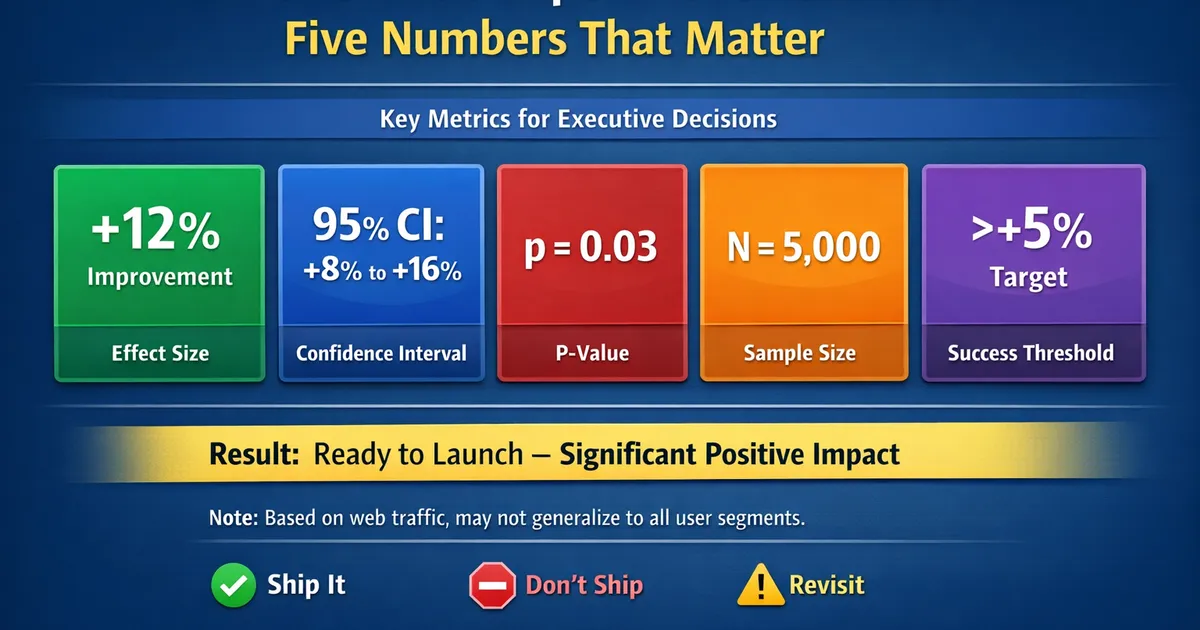
The One-Slide Experiment Readout: Five Numbers That Matter
A template for presenting experiment results in one slide. Focus on the five numbers executives actually need to make a decision.
Quick Hits
- •Five numbers: effect size, CI bounds, p-value, sample size, and practical threshold
- •Answer the question before explaining the methodology
- •Color-code: green for ship, red for don't ship, yellow for inconclusive
- •Include one sentence on the key caveat or limitation
- •Put methodology details in backup slides, not the main readout
TL;DR
One slide, five numbers, one recommendation. Executives need effect size, confidence interval bounds, p-value, sample size, and how you defined success—not your methodology. Lead with the answer (ship/don't ship/inconclusive), show the key numbers, add one caveat, and save the details for backup slides.
The Five Numbers
What Executives Need
| Number | What It Answers |
|---|---|
| Effect size | "How much did it move?" |
| CI lower bound | "Could it actually be zero or negative?" |
| CI upper bound | "How good could it be?" |
| p-value | "Is this real or noise?" |
| Sample size | "Do we have enough data?" |
Plus: Your pre-specified threshold for success (MDE)
What They Don't Need (On This Slide)
- Which statistical test you used
- How you calculated standard errors
- Details of your randomization scheme
- All 15 secondary metrics
- Segment breakdowns (save for Q&A)
The Template
┌─────────────────────────────────────────────────────────────────┐
│                                                                 │
│  EXPERIMENT: [Feature Name]                                     │
│  ─────────────────────────────────────────────────────────────  │
│                                                                 │
│  RECOMMENDATION: [🟢 SHIP / 🔴 DON'T SHIP / 🟡 INCONCLUSIVE]    │
│                                                                 │
│  ┌─────────────────────────────────────────────────────────┐   │
│  │                                                         │   │
│  │  PRIMARY METRIC: Conversion Rate                        │   │
│  │                                                         │   │
│  │  Treatment: 4.52%     Control: 4.18%                   │   │
│  │                                                         │   │
│  │  LIFT: +8.1%                                           │   │
│  │  95% CI: +3.2% to +13.0%                               │   │
│  │  p-value: 0.001                                        │   │
│  │                                                         │   │
│  │  Success threshold (MDE): +5%                          │   │
│  │  Sample: 125,000 users (100% of target)                │   │
│  │                                                         │   │
│  └─────────────────────────────────────────────────────────┘   │
│                                                                 │
│  GUARDRAILS: ✅ Revenue stable | ✅ Errors stable              │
│                                                                 │
│  CAVEAT: Mobile conversion flat (+1%, not significant);        │
│          gains driven by desktop users                          │
│                                                                 │
└─────────────────────────────────────────────────────────────────┘
Color Coding Decisions
Green: Ship
Criteria:
- CI lower bound > 0
- Effect exceeds MDE (or CI lower bound exceeds MDE)
- No guardrail violations
- Sufficient sample size
Red: Don't Ship
Criteria:
- CI upper bound < 0 (clear negative effect), OR
- Guardrail violations, OR
- Clear negative despite possible positive edge
Yellow: Inconclusive
Criteria:
- CI includes both meaningful positive and meaningful negative
- Insufficient sample size
- Conflicting metrics
- Needs more data or deliberate risk decision
Implementation
def generate_readout(experiment_name, metric_name,
                      control_value, treatment_value,
                      ci_lower, ci_upper, p_value,
                      sample_size, target_sample,
                      mde, guardrails_ok=True):
    """
    Generate one-slide readout summary.
    """
    # Calculate lift
    lift = (treatment_value - control_value) / control_value * 100

    # Determine recommendation
    if ci_lower > 0 and guardrails_ok:
        if ci_lower > mde:
            recommendation = "🟢 SHIP (high confidence)"
        else:
            recommendation = "🟢 SHIP"
    elif ci_upper < 0:
        recommendation = "🔴 DON'T SHIP"
    elif not guardrails_ok:
        recommendation = "🔴 DON'T SHIP (guardrail violation)"
    elif ci_lower < 0 < ci_upper:
        recommendation = "🟡 INCONCLUSIVE"
    else:
        recommendation = "🟡 NEEDS REVIEW"

    readout = f"""
{'='*60}
EXPERIMENT: {experiment_name}
{'='*60}

RECOMMENDATION: {recommendation}

PRIMARY METRIC: {metric_name}
  Treatment: {treatment_value:.2%}    Control: {control_value:.2%}

  LIFT: {lift:+.1f}%
  95% CI: {ci_lower:+.1f}% to {ci_upper:+.1f}%
  p-value: {p_value:.4f}

  Success threshold (MDE): {mde:+.1f}%
  Sample: {sample_size:,} users ({sample_size/target_sample*100:.0f}% of target)

GUARDRAILS: {'✅ OK' if guardrails_ok else '❌ VIOLATION'}
{'='*60}
"""
    return readout


# Example: Successful experiment
print(generate_readout(
    experiment_name="New Checkout Flow v2",
    metric_name="Conversion Rate",
    control_value=0.0418,
    treatment_value=0.0452,
    ci_lower=3.2,
    ci_upper=13.0,
    p_value=0.001,
    sample_size=125000,
    target_sample=120000,
    mde=5.0,
    guardrails_ok=True
))

# Example: Inconclusive experiment
print(generate_readout(
    experiment_name="Homepage Redesign",
    metric_name="Click-through Rate",
    control_value=0.082,
    treatment_value=0.086,
    ci_lower=-2.1,
    ci_upper=8.9,
    p_value=0.23,
    sample_size=45000,
    target_sample=80000,
    mde=5.0,
    guardrails_ok=True
))
Handling Different Scenarios
Scenario 1: Clear Win
RECOMMENDATION: 🟢 SHIP

LIFT: +12.3% (95% CI: +7.1% to +17.5%, p < 0.001)
MDE was +5%, CI entirely above it.

GUARDRAILS: All stable
CAVEAT: None significant
Scenario 2: Clear Loss
RECOMMENDATION: 🔴 DON'T SHIP

LIFT: -8.2% (95% CI: -14.1% to -2.3%, p = 0.006)
Significant negative effect on conversion.

GUARDRAILS: N/A (primary metric failed)
CAVEAT: Error rate also increased +15%
Scenario 3: Inconclusive
RECOMMENDATION: 🟡 INCONCLUSIVE

LIFT: +4.1% (95% CI: -1.8% to +10.0%, p = 0.17)
Cannot rule out negative effect; cannot confirm positive.

OPTIONS:
A) Extend 2 weeks for conclusive result
B) Ship accepting ~20% chance of no/negative effect
C) Abandon and reallocate resources

RECOMMENDATION: Option A (extend)
Scenario 4: Guardrail Failure
RECOMMENDATION: 🔴 DON'T SHIP (guardrail)

PRIMARY: +6.2% (95% CI: +2.1% to +10.3%, p = 0.003)
Primary metric positive and significant.

GUARDRAIL VIOLATION:
❌ Error rate: +45% (threshold: <10% increase)

CAVEAT: Conversion gains may be driven by users who
couldn't complete purchase due to errors.
Backup Slides
Slide 2: Secondary Metrics
┌─────────────────────────────────────────────────────────────┐
│  SECONDARY METRICS                                          │
├────────────────┬──────────┬────────────────────┬───────────┤
│ Metric         │ Lift     │ 95% CI             │ p-value   │
├────────────────┼──────────┼────────────────────┼───────────┤
│ Revenue/User   │ +5.2%    │ (-1.8%, +12.2%)    │ 0.14      │
│ Sessions/User  │ +2.1%    │ (-0.5%, +4.7%)     │ 0.11      │
│ Time on Site   │ -3.4%    │ (-7.2%, +0.4%)     │ 0.08      │
│ Bounce Rate    │ -1.2%    │ (-4.1%, +1.7%)     │ 0.42      │
└────────────────┴──────────┴────────────────────┴───────────┘
│                                                             │
│ NOTE: No secondary metrics significant. Directionally       │
│ consistent with primary metric.                             │
└─────────────────────────────────────────────────────────────┘
Slide 3: Segment Analysis
┌─────────────────────────────────────────────────────────────┐
│  SEGMENT ANALYSIS (Pre-specified)                           │
├────────────────┬──────────┬────────────────────┬───────────┤
│ Segment        │ Lift     │ 95% CI             │ p-value   │
├────────────────┼──────────┼────────────────────┼───────────┤
│ Desktop        │ +11.2%   │ (+5.4%, +17.0%)    │ <0.001    │
│ Mobile         │ +1.3%    │ (-5.2%, +7.8%)     │ 0.69      │
│ New Users      │ +9.8%    │ (+3.1%, +16.5%)    │ 0.004     │
│ Returning      │ +6.4%    │ (+0.8%, +12.0%)    │ 0.03      │
└────────────────┴──────────┴────────────────────┴───────────┘
│                                                             │
│ NOTE: Effect appears desktop-driven. Mobile showed no       │
│ significant effect (test for interaction: p = 0.08).        │
│ Consider mobile-specific follow-up.                         │
└─────────────────────────────────────────────────────────────┘
Slide 4: Methodology
┌─────────────────────────────────────────────────────────────┐
│  METHODOLOGY                                                │
├─────────────────────────────────────────────────────────────┤
│ Design: User-level randomization, 50/50 split              │
│ Period: Jan 15 - Jan 28, 2026 (14 days)                    │
│ Analysis: Two-proportion z-test, α = 0.05                  │
│ Pre-registration: [Link to doc]                            │
│                                                             │
│ Data Quality:                                               │
│ ✅ SRM check passed (p = 0.41)                             │
│ ✅ No assignment bugs detected                              │
│ ✅ Exposure logging validated                               │
│                                                             │
│ Deviations from Plan: None                                  │
└─────────────────────────────────────────────────────────────┘
Verbal Presentation Tips
The 30-Second Version
"We tested the new checkout flow and recommend shipping. Conversion increased 8%, and we're confident the true effect is at least 3%—well above our 5% threshold. The main caveat: gains are desktop-driven; mobile was flat. Any questions?"
Anticipate These Questions
| Question | Be Ready With |
|---|---|
| "Is this real?" | p-value, sample size, SRM check |
| "How much could it be?" | Full confidence interval |
| "What about [other metric]?" | Secondary metrics table |
| "What about mobile?" | Segment breakdown |
| "What could go wrong?" | Caveats, guardrails |
Related Methods
- Analytics Reporting (Pillar) - Full reporting guide
- Communicating Uncertainty - Stakeholder strategies
- When to Say Inconclusive - Decision rules
- Writing Methods Sections - Documentation
Key Takeaway
The one-slide readout is about decisions, not statistics. Lead with your recommendation (ship/don't ship/inconclusive), show five key numbers (effect, CI bounds, p-value, sample), note one caveat, and stop. Executives will ask questions if they want more—that's what backup slides are for. If you can't fit your conclusion on one slide, you're either overcomplicating the presentation or the results genuinely need more nuance (which itself is a finding worth stating clearly).
References
- https://www.microsoft.com/en-us/research/publication/top-challenges-from-the-first-practical-online-controlled-experiments-summit/
- https://www.exp-platform.com/Documents/controlledExperimentDMKD.pdf
- Kohavi, R., Longbotham, R., Sommerfield, D., & Henne, R. M. (2009). Controlled experiments on the web: survey and practical guide. *Data Mining and Knowledge Discovery*, 18(1), 140-181.
- Dmitriev, P., Gupta, S., Kim, D. W., & Vaz, G. (2017). A dirty dozen: twelve common metric interpretation pitfalls in online controlled experiments. *KDD*, 1427-1436.
Frequently Asked Questions
What if I have multiple metrics?
How do I present inconclusive results?
Should I include statistical details?
Key Takeaway
Executives need to make decisions, not understand statistics. Give them five numbers: the effect size, confidence interval bounds, p-value, sample size, and your pre-specified success threshold. Add one sentence on the key caveat. Put everything else in backup slides. If you can't fit it on one slide, you're overcomplicating it.