Contents
P-Values vs. Confidence Intervals: How to Interpret Both for Decisions
Understand the relationship between p-values and confidence intervals, when they agree, when they seem to disagree, and how to use them together for better decisions.
Quick Hits
- •P-values tell you probability of data under null; CIs tell you plausible parameter values
- •95% CI excludes 0 ⟺ p < 0.05 (for testing against null of 0)
- •CIs give more information: direction, magnitude, and precision
- •For decisions, CI bounds matter more than p-values
TL;DR
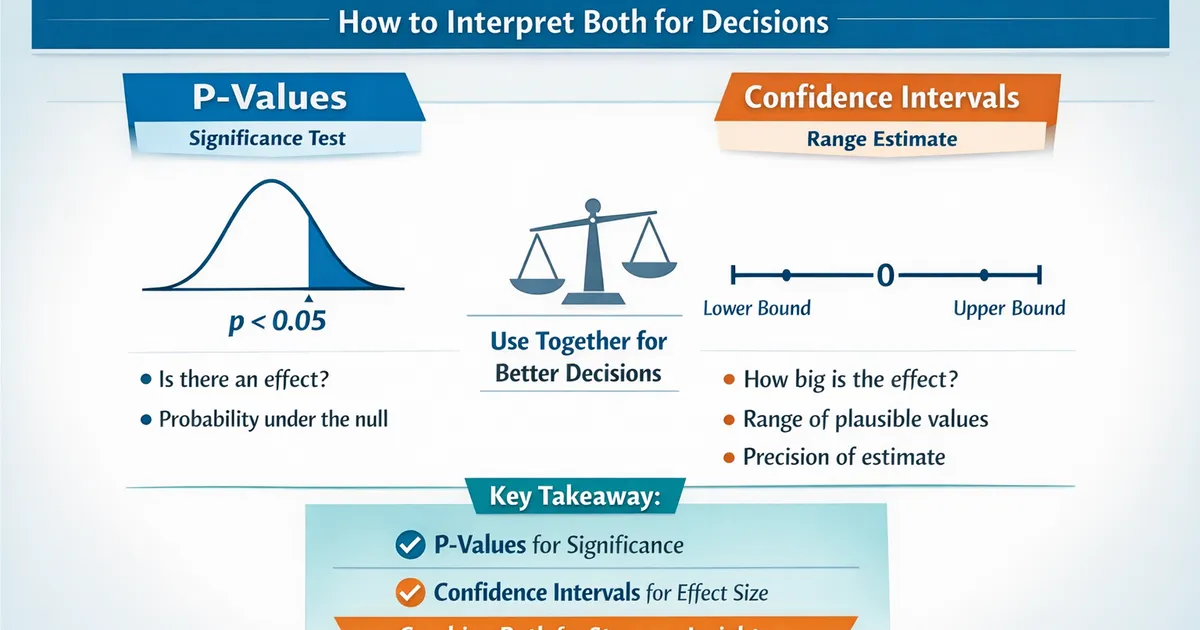
P-values tell you the probability of seeing your data (or more extreme) if the null hypothesis is true. Confidence intervals give you a range of plausible values for the true parameter. They're mathematically linked: a 95% CI that excludes zero corresponds to . But CIs are more informative for decisions because they show effect magnitude and precision, not just whether to reject the null.
What Each Tells You
P-Values
P-value = P(data this extreme or more | H₀ is true)
In plain English: "If there were truly no effect, what's the probability of seeing results as extreme as what we observed?"
P < 0.05 means:
- "This would be surprising if H₀ were true"
- "We reject H₀ at the 0.05 level"
A p-value does NOT mean:
- P(H₀ is true)
- P(H₁ is true)
- Probability the effect is real
- Size of the effect
What p-values don't tell you:
- How big the effect is
- Whether the effect matters practically
- The probability of replication
Confidence Intervals
A 95% CI is a range constructed such that if we repeated the study many times, 95% of such intervals would contain the true parameter value. In practice: "We're 95% confident the true effect is in this range."
What a CI tells you:
- Plausible values for the true effect
- Precision of the estimate (narrow = precise)
- Whether the effect is significant (if 0 is excluded)
- Whether the effect might be practically important
A CI does NOT mean:
- 95% of the data falls in this range
- 95% probability the true value is in THIS interval (the true value is fixed; it's either in there or not)
The Mathematical Relationship
They're Two Sides of the Same Coin
import numpy as np
from scipy import stats

np.random.seed(42)

# Generate data
control = np.random.normal(100, 15, 50)
treatment = np.random.normal(108, 15, 50)

diff = np.mean(treatment) - np.mean(control)
se = np.sqrt(np.var(control, ddof=1)/50 + np.var(treatment, ddof=1)/50)

# P-value (two-sided test against H₀: diff = 0)
t_stat = diff / se
df = 98
p_value = 2 * (1 - stats.t.cdf(abs(t_stat), df))

# 95% CI
t_crit = stats.t.ppf(0.975, df)
ci_low = diff - t_crit * se
ci_high = diff + t_crit * se
The observed difference and its standard error feed into both the p-value and the CI. When the 95% CI excludes zero, it means p < 0.05, and vice versa.
The key relationship:
- 95% CI excludes 0 ⟺ p < 0.05
- 99% CI excludes 0 ⟺ p < 0.01
- (1-α)% CI excludes H₀ ⟺ p < α
Visual Demonstration
def visualize_ci_pvalue_link():
    """
    Show how CI relates to p-value visually.
    """
    import matplotlib.pyplot as plt

    np.random.seed(42)

    # Three scenarios
    scenarios = [
        {'diff': 10, 'se': 3, 'label': 'Significant'},
        {'diff': 3, 'se': 3, 'label': 'Borderline'},
        {'diff': 1, 'se': 3, 'label': 'Not significant'}
    ]

    fig, axes = plt.subplots(1, 3, figsize=(15, 4))

    for ax, s in zip(axes, scenarios):
        ci_low = s['diff'] - 1.96 * s['se']
        ci_high = s['diff'] + 1.96 * s['se']
        p_val = 2 * (1 - stats.norm.cdf(abs(s['diff'] / s['se'])))

        # Plot CI
        ax.errorbar(s['diff'], 0, xerr=[[s['diff'] - ci_low], [ci_high - s['diff']]],
                   fmt='o', capsize=10, markersize=10, capthick=2)
        ax.axvline(0, color='red', linestyle='--', label='Null (H₀: diff=0)')
        ax.set_xlim(-10, 20)
        ax.set_ylim(-0.5, 0.5)
        ax.set_title(f"{s['label']}\nDiff={s['diff']}, p={p_val:.3f}")
        ax.set_xlabel('Effect Size')
        ax.legend()

    plt.tight_layout()
    return fig
Why CIs Are Often More Useful
CI Tells You What P-Value Can't
Consider two scenarios with the same p-value (p = 0.0455) but different sample sizes:
- Precise estimate (n = 500): Observed difference = 5, 95% CI: [0.10, 9.90]
- Imprecise estimate (n = 50): Observed difference = 5, 95% CI: [0.10, 9.90]
Both have the same p-value, but the CI tells you more:
- CI width shows precision
- CI bounds show the plausible effect range
- You can assess practical significance from CI bounds
Using CIs for Decisions
- CI fully above threshold — CI: [3, 7], threshold: 2 → Implement. The effect definitely exceeds the threshold.
- CI overlaps threshold — CI: [1, 5], threshold: 2 → Uncertain. Need more data or consider risk tolerance.
- CI fully below threshold — CI: [0.5, 2.5], threshold: 3 → Don't implement. The effect is likely below the threshold.
- CI contains zero but above threshold possible — CI: [-1, 4], threshold: 2 → Not significant, but a practical effect is still possible. More data needed.
Interpreting Together
The Complete Picture
def interpret_together(diff, se, threshold=None, alpha=0.05):
    z = diff / se
    p_value = 2 * (1 - stats.norm.cdf(abs(z)))
    z_crit = stats.norm.ppf(1 - alpha/2)
    ci_low = diff - z_crit * se
    ci_high = diff + z_crit * se
    return {'diff': diff, 'p_value': p_value, 'ci': (ci_low, ci_high)}
First check statistical significance: if the CI does not include 0, the result is significant at . Then check practical significance against a pre-defined threshold:
- CI entirely above threshold → Definitely exceeds it. Strong evidence to implement.
- CI entirely below threshold → Definitely below it. Significant but may not be worth implementing.
- CI overlaps threshold → Uncertain. May need more data.
Scenario 1 — Clearly beneficial (diff=10, se=3, threshold=5): Point estimate of 10, 95% CI [4.12, 15.88], p < 0.001. The entire CI is above the threshold. Strong evidence for a meaningful effect.
Scenario 2 — Significant but possibly trivial (diff=2, se=0.5, threshold=5): Point estimate of 2, 95% CI [1.02, 2.98], p < 0.001. Statistically significant, but the entire CI falls below the practical threshold of 5. May not be worth implementing.
Scenario 3 — Not significant but potentially meaningful (diff=5, se=4, threshold=5): Point estimate of 5, 95% CI [-2.84, 12.84], p = 0.211. Not significant, but the CI includes large positive effects above the threshold. Consider gathering more data.
Common Misinterpretations
P-value myths:
- Wrong: "p = 0.03 means 3% chance the null is true." Right: P-value is P(data|H₀), not P(H₀|data).
- Wrong: "p = 0.03 is 'more significant' than p = 0.04." Right: Both just suggest H₀ is unlikely; don't over-interpret small differences.
- Wrong: "p > 0.05 means no effect exists." Right: It means we can't rule out chance, not that the effect is zero.
CI myths:
- Wrong: "95% probability the true value is in this interval." Right: The true value is fixed; either it's in there or not.
- Wrong: "95% of the data falls in this interval." Right: The CI is about the parameter estimate, not data spread.
- Wrong: "Overlapping CIs mean no significant difference." Right: CIs can overlap but groups can still differ significantly.
Practical Decision Framework
Step 1: Define what matters BEFORE analysis.
- What's the minimum effect that would change your decision?
- What's the acceptable risk of false positive/negative?
Step 2: Look at the CI first.
- What range of effects is plausible?
- Does the CI include practically important effects?
- Does the CI include trivial effects?
Step 3: Consider the p-value.
- Is the result statistically significant?
- If significant but the CI includes trivial effects: beware over-interpretation.
- If not significant but the CI includes important effects: consider getting more data.
Step 4: Make a decision.
- Scenario A: CI entirely in "actionable" range, p < α → Strong evidence to act.
- Scenario B: CI entirely in "trivial" range, p < α → Significant but not worth acting on.
- Scenario C: CI in "actionable" range, p > α → Promising but uncertain; consider more data.
- Scenario D: CI entirely in "trivial" range, p > α → No evidence of meaningful effect.
- Scenario E: CI spans trivial and actionable → Inconclusive; more data needed for confident decision.
R Implementation
# P-value and CI interpretation in R

interpret_result <- function(diff, se, threshold = NULL, alpha = 0.05) {
  z <- diff / se
  p_value <- 2 * (1 - pnorm(abs(z)))
  z_crit <- qnorm(1 - alpha/2)
  ci_low <- diff - z_crit * se
  ci_high <- diff + z_crit * se

  cat("INTEGRATED INTERPRETATION\n")
  cat(rep("=", 50), "\n\n")

  cat(sprintf("Point estimate: %.3f\n", diff))
  cat(sprintf("95%% CI: [%.3f, %.3f]\n", ci_low, ci_high))
  cat(sprintf("P-value: %.4f\n", p_value))

  cat("\nStatistical significance:\n")
  if (p_value < alpha) {
    cat(sprintf("  Significant at alpha = %.2f\n", alpha))
  } else {
    cat(sprintf("  Not significant at alpha = %.2f\n", alpha))
  }

  if (!is.null(threshold)) {
    cat("\nPractical significance:\n")
    if (ci_low > threshold) {
      cat(sprintf("  Definitely exceeds threshold (%.1f)\n", threshold))
    } else if (ci_high < threshold) {
      cat(sprintf("  Definitely below threshold (%.1f)\n", threshold))
    } else {
      cat(sprintf("  Uncertain relative to threshold (%.1f)\n", threshold))
    }
  }

  invisible(list(p_value = p_value, ci = c(ci_low, ci_high)))
}

# Usage:
# interpret_result(diff = 5, se = 2, threshold = 3)
Related Methods
- Effect Sizes Master Guide — The pillar article
- When CIs and P-Values Disagree — Resolving apparent conflicts
- Practical Significance Thresholds — Setting meaningful thresholds
Key Takeaway
P-values and confidence intervals are mathematically linked but serve different purposes. P-values address whether an effect exists (statistical significance). CIs show how big it might be and with what precision. For decisions, focus on the CI: Does it contain only trivial effects? Only meaningful effects? Both? This determines your action more reliably than whether p crosses 0.05. Report both, but let the CI guide your practical interpretation.
References
- https://doi.org/10.1038/d41586-019-00857-9
- https://www.jstor.org/stable/2684655
- Cumming, G., & Finch, S. (2005). Inference by eye: confidence intervals and how to read pictures of data. *American Psychologist*, 60(2), 170-180.
- Greenland, S., Senn, S. J., Rothman, K. J., Carlin, J. B., Poole, C., Goodman, S. N., & Altman, D. G. (2016). Statistical tests, P values, confidence intervals, and power: a guide to misinterpretations. *European Journal of Epidemiology*, 31(4), 337-350.
- Wasserstein, R. L., & Lazar, N. A. (2016). The ASA statement on p-values: context, process, and purpose. *The American Statistician*, 70(2), 129-133.
Frequently Asked Questions
Which is better, p-values or confidence intervals?
Why do some statisticians want to abandon p-values?
Can a 95% CI contain 0 but p > 0.05?
Key Takeaway
P-values and confidence intervals are mathematically related but answer different questions. P-values ask 'does it exist?' while CIs ask 'how big and how precise?' For decision-making, CIs are usually more informative because they show the range of plausible effect sizes. Use both together: p-values for significance, CIs for practical interpretation.