Contents
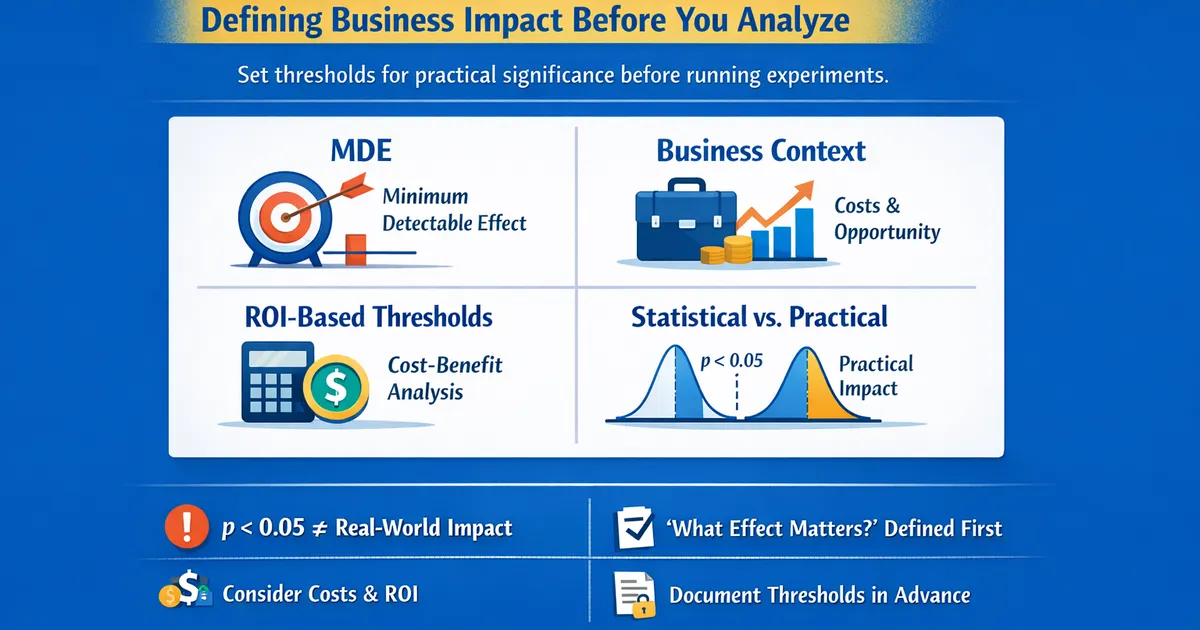
Practical Significance Thresholds: Defining Business Impact Before You Analyze
Learn how to set meaningful thresholds for practical significance before running experiments. Covers MDE, business context, ROI-based thresholds, and the difference between statistical and practical significance.
Quick Hits
- •Statistical significance (p < 0.05) doesn't mean the effect matters
- •Define 'what effect would change our decision' BEFORE analyzing
- •Consider implementation costs, opportunity costs, and expected ROI
- •Document thresholds in advance to prevent post-hoc rationalization
TL;DR
Statistical significance () tells you an effect probably exists. Practical significance tells you it's big enough to matter. With enough data, even trivial effects become statistically significant. Define your practical significance threshold BEFORE analyzing: What effect size would change your decision? This prevents post-hoc rationalization and keeps focus on what actually matters for your business.
The Problem
When Significance Doesn't Mean Important
import numpy as np
from scipy import stats

np.random.seed(42)

n = 100000
true_effect = 0.3  # 0.3 units on a 100-point scale

control = np.random.normal(50, 15, n)
treatment = np.random.normal(50 + true_effect, 15, n)

_, p = stats.ttest_ind(control, treatment)
d = true_effect / 15  # Cohen's d = 0.02 (negligible)
With 100,000 users per group and a true effect of just 0.3 points on a 100-point scale (Cohen's d = 0.02), the result is statistically significant (). But a 0.3-point difference is meaningless — no one would notice or care. Yet we would "reject the null hypothesis."
The Two Questions
These are two separate questions:
- Statistical significance — Is there probably a real effect? (Tool: p-value / hypothesis test. Answer: yes/no.)
- Practical significance — Is the effect big enough to matter? (Tool: effect size vs. threshold. Answer: yes/no/uncertain.)
The combinations determine the action:
- Stat sig + practically sig → Action. Real effect that matters.
- Stat sig + NOT practically sig → No action. Real effect but too small to matter.
- NOT stat sig + practically sig → Need more data. Can't tell if effect is real, but it might be important.
- NOT stat sig + NOT practically sig → No action. No evidence of a meaningful effect.
Setting Thresholds
Business-Based Approach
Ask these questions to set your threshold:
Implementation cost:
- What does it cost to implement this change?
- Engineering time, design resources, QA?
- Ongoing maintenance costs?
Opportunity cost:
- What else could we do with these resources?
- How long does the experiment delay other work?
- What's the cost of being wrong?
Expected impact:
- What metric are we moving?
- How does that metric translate to business value?
- What's the lifetime value of the improvement?
Risk tolerance:
- What if we implement and the effect disappears?
- What if the effect is real but smaller than measured?
- Can we easily revert?
Threshold calculation: Minimum effect = Cost / (Value per unit x Scale)
For example, with an implementation cost of $50,000, a value of $10 per conversion, 1,000,000 users per year, and a current conversion rate of 5%: the minimum lift for a 1-year ROI is $50,000 / ($10 x 1,000,000) = 0.5% absolute, or 10% relative.
def calculate_required_lift(implementation_cost, value_per_conversion,
                           annual_users, current_rate, payback_period=1):
    annual_value_per_pct = value_per_conversion * annual_users / 100
    min_absolute_lift = implementation_cost / (annual_value_per_pct * payback_period)
    min_relative_lift = min_absolute_lift / current_rate * 100
    return {
        'min_absolute_lift': min_absolute_lift,
        'min_relative_lift': min_relative_lift,
    }
Domain-Specific Guidelines
E-commerce / Conversion
Conversion rate: Typical baseline 2-5%. A meaningful lift is 5-10% relative (e.g., 3% → 3.15%). Even 0.1% absolute can be huge at scale.
Average order value: Typical baseline $50-150. A meaningful lift is 3-5% relative (e.g., $80 → $84). Consider the distribution — the median may matter more than the mean.
Revenue per visitor: Typical baseline $1-5. A meaningful lift is 5-15% relative (e.g., $2.50 → $2.75). This compounds conversion and AOV.
Cart abandonment: Typical baseline 60-80%. A meaningful change is 2-5% absolute reduction (e.g., 70% → 67%). Absolute change matters here.
SaaS / Retention
Monthly churn rate: Typical baseline 2-8%. A meaningful change is 0.5-1% absolute reduction (e.g., 5% → 4.5%). Small changes compound significantly.
Trial-to-paid conversion: Typical baseline 5-15%. A meaningful lift is 10-20% relative (e.g., 10% → 11%). Very high LTV justifies small lifts.
Feature adoption: Typical baseline 20-60%. A meaningful lift is 5-10% absolute (e.g., 30% → 35%). Depends on feature importance.
NPS / Satisfaction: Typical baseline 30-50. A meaningful change is 5-10 points (e.g., 40 → 45 NPS). This is a leading indicator of retention.
Pre-Specifying Thresholds
Why Pre-Specification Matters
Problems without pre-specification:
- Post-hoc rationalization: "This effect is big enough"
- Goal posts move based on results
- Confirmation bias in interpretation
- Harder to defend decisions to stakeholders
Benefits of pre-specification:
- Clear decision criteria before seeing results
- Separates analysis from decision-making
- Easier to communicate and get buy-in
- Documents your thinking for future reference
Documentation Template
1. Metric definition. Primary metric (e.g., conversion rate), current baseline (e.g., 5.0%), and measurement period (e.g., 2 weeks).
2. Threshold calculation. Implementation cost ($X = engineering + design + other). Expected annual impact per 1% lift ($A based on users affected and value per conversion). Payback period. Then compute the minimum threshold: absolute lift (e.g., 5.0% → 5.5%) and relative improvement.
3. Decision rules. If the CI is entirely above the threshold → ship. If the CI is entirely below the threshold → do not ship. If the CI spans the threshold → document next steps or risk-based decision.
4. Rationale. Why this threshold makes sense for this experiment, and any context-specific considerations.
5. Sign-off. Get approval from the relevant stakeholder before the experiment begins.
Making Decisions
Decision Framework
Check statistical significance (does the CI exclude 0?) and practical significance (how does the CI relate to your threshold?) separately, then combine:
Scenario 1 — Clear win. Effect = 0.08, 95% CI [0.05, 0.11], threshold = 0.03. Statistically significant (CI excludes 0) and the entire CI is above the threshold. → Ship. Strong evidence of a meaningful effect.
Scenario 2 — Significant but trivial. Effect = 0.02, 95% CI [0.01, 0.03], threshold = 0.05. Statistically significant, but the entire CI is below the threshold. → Do not ship. The effect is real but too small to matter.
Scenario 3 — Promising but uncertain. Effect = 0.04, 95% CI [-0.01, 0.09], threshold = 0.03. Not statistically significant (CI includes 0), but the CI also includes values above the threshold. → Inconclusive. Can't rule out a meaningful effect. Options: gather more data, accept uncertainty, or decide based on priors and risk tolerance.
Common Mistakes
Using Cohen's benchmarks blindly. d = 0.2 is "small" but could be huge in your context. Derive thresholds from business impact instead.
Setting threshold post-hoc. Easy to rationalize any result as "meaningful." Document the threshold before seeing results.
Ignoring confidence interval width. The point estimate might be above the threshold but the CI isn't. Make decisions based on CI bounds, not just the point estimate.
Conflating statistical and practical significance. doesn't mean the effect matters. Evaluate both separately.
Using the same threshold for all metrics. Different metrics have different scales and business value. Calculate a threshold for each primary metric.
R Implementation
# Practical significance framework in R

decision_framework <- function(effect, ci_low, ci_high, threshold) {
  cat("PRACTICAL SIGNIFICANCE ASSESSMENT\n")
  cat(rep("=", 50), "\n\n")

  cat(sprintf("Effect: %.3f\n", effect))
  cat(sprintf("95%% CI: [%.3f, %.3f]\n", ci_low, ci_high))
  cat(sprintf("Threshold: %.3f\n\n", threshold))

  # Assessments
  stat_sig <- (ci_low > 0) | (ci_high < 0)
  definitely_meaningful <- ci_low > threshold
  definitely_trivial <- ci_high < threshold

  cat("Statistical significance: ")
  cat(ifelse(stat_sig, "Yes\n", "No\n"))

  cat("Practical significance: ")
  if (definitely_meaningful) {
    cat("Definitely meaningful\n")
  } else if (definitely_trivial) {
    cat("Definitely trivial\n")
  } else {
    cat("Uncertain\n")
  }

  cat("\nDECISION: ")
  if (stat_sig && definitely_meaningful) {
    cat("SHIP - Clear meaningful effect\n")
  } else if (stat_sig && definitely_trivial) {
    cat("DO NOT SHIP - Effect too small\n")
  } else {
    cat("NEEDS JUDGMENT - Consider context\n")
  }
}

# Usage:
# decision_framework(effect = 0.05, ci_low = 0.02, ci_high = 0.08, threshold = 0.03)
Related Methods
- Effect Sizes Master Guide — The pillar article
- MDE and Sample Size — Planning for detection
- Power Analysis — Powering for meaningful effects
Key Takeaway
Practical significance means the effect is large enough to matter for your decision. Define this threshold BEFORE analyzing based on business context: implementation cost, expected value, and stakeholder expectations. Statistical significance without practical significance is a false positive for decision-making. Use confidence intervals to assess whether effects are definitively meaningful, definitively trivial, or uncertain—and plan your decision rule for each scenario in advance.
References
- https://doi.org/10.1037/a0024338
- https://doi.org/10.1002/9781118445112.stat06538
- Kirk, R. E. (1996). Practical significance: A concept whose time has come. *Educational and Psychological Measurement*, 56(5), 746-759.
- Ferguson, C. J. (2009). An effect size primer: A guide for clinicians and researchers. *Professional Psychology: Research and Practice*, 40(5), 532-538.
- Lakens, D., Scheel, A. M., & Isager, P. M. (2018). Equivalence testing for psychological research: A tutorial. *Advances in Methods and Practices in Psychological Science*, 1(2), 259-269.
Frequently Asked Questions
How do I determine what effect size is 'meaningful'?
Should I use Cohen's benchmarks (0.2, 0.5, 0.8)?
What if my CI spans both meaningful and trivial effects?
Key Takeaway
Practical significance means the effect is large enough to matter for your decision. Define this threshold BEFORE analyzing, based on business context: What effect would justify implementation costs? What would stakeholders consider meaningful? Statistical significance without practical significance is a false positive for decision-making.