Contents
Effect Sizes, Confidence Intervals, and Practical Significance
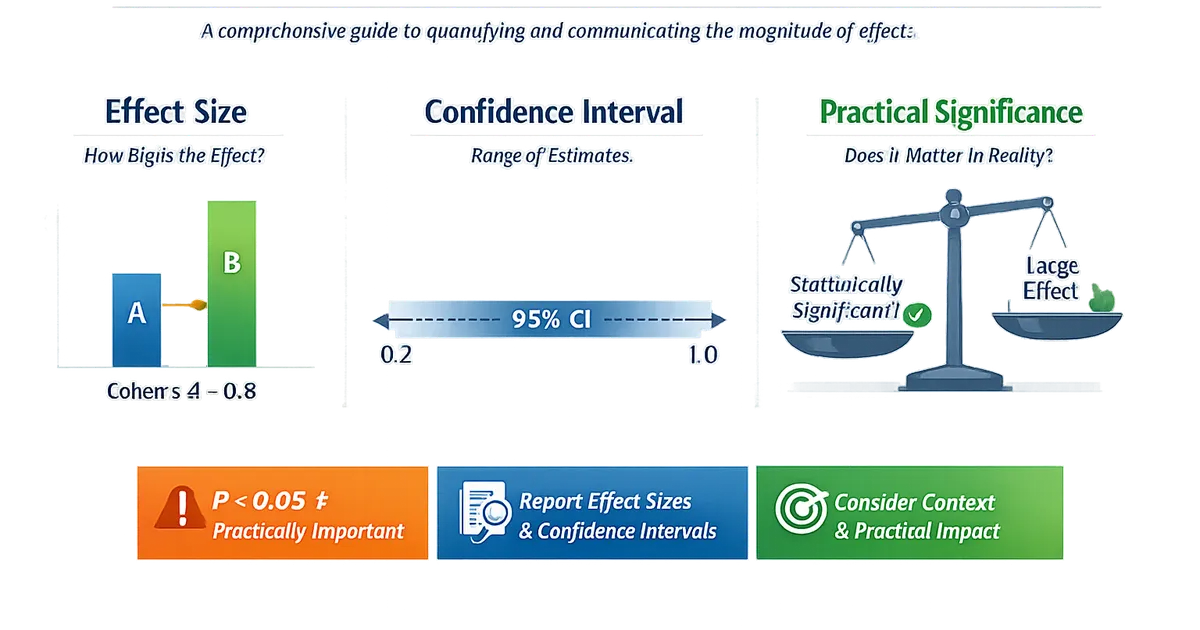
A comprehensive guide to quantifying and communicating the magnitude of effects. Covers standardized and raw effect sizes, confidence intervals, and when statistical significance doesn't mean practical importance.
Quick Hits
- •P-values tell you IF an effect exists; effect sizes tell you HOW BIG
- •Confidence intervals combine significance testing and effect estimation
- •Statistical significance ≠ practical significance (especially with large n)
- •Raw effect sizes (actual units) often communicate better than standardized ones
- •Always report effect sizes alongside p-values
TL;DR
Effect sizes tell you HOW BIG an effect is, not just whether it exists. Confidence intervals give you a range of plausible effect sizes. The critical insight: statistical significance () doesn't mean practical significance—with enough data, trivial effects become "significant." Always report effect sizes with confidence intervals, and establish what effect size would actually matter BEFORE analyzing.
The Three Questions
When analyzing data, you're really asking three questions:
- Is there an effect? → P-value, hypothesis testing
- How big is it? → Effect size
- What's the uncertainty? → Confidence interval
P-values alone answer only #1. Effect sizes and CIs complete the picture.
import numpy as np
from scipy import stats
import pandas as pd

def demonstrate_three_questions():
    """
    Show how effect sizes and CIs complement p-values.
    """
    np.random.seed(42)

    # Three scenarios, all "significant"
    scenarios = {
        'Large effect, small n': {
            'control': np.random.normal(50, 10, 20),
            'treatment': np.random.normal(60, 10, 20)  # d ≈ 1.0
        },
        'Medium effect, medium n': {
            'control': np.random.normal(50, 10, 100),
            'treatment': np.random.normal(55, 10, 100)  # d ≈ 0.5
        },
        'Tiny effect, large n': {
            'control': np.random.normal(50, 10, 10000),
            'treatment': np.random.normal(50.5, 10, 10000)  # d ≈ 0.05
        }
    }

    print("Three Significant Results with Very Different Meaning:")
    print("=" * 70)

    for name, data in scenarios.items():
        c, t = data['control'], data['treatment']
        n = len(c)

        # P-value
        _, p = stats.ttest_ind(c, t)

        # Effect size (Cohen's d)
        pooled_std = np.sqrt(((n-1)*np.var(c, ddof=1) + (n-1)*np.var(t, ddof=1)) / (2*n - 2))
        d = (np.mean(t) - np.mean(c)) / pooled_std

        # Raw difference with CI
        diff = np.mean(t) - np.mean(c)
        se_diff = np.sqrt(np.var(c, ddof=1)/n + np.var(t, ddof=1)/n)
        ci_low, ci_high = diff - 1.96*se_diff, diff + 1.96*se_diff

        print(f"\n{name} (n={n} per group):")
        print(f"  P-value: {p:.4f} {'(significant!)' if p < 0.05 else ''}")
        print(f"  Raw difference: {diff:.2f} units [95% CI: {ci_low:.2f}, {ci_high:.2f}]")
        print(f"  Cohen's d: {d:.2f}")

    print("\n" + "=" * 70)
    print("KEY INSIGHT: All three are p < 0.05, but only the first")
    print("two might be practically meaningful. P-values don't tell")
    print("you whether the effect MATTERS.")


demonstrate_three_questions()
Effect Sizes for Mean Differences
Raw (Unstandardized) Effect Sizes
The actual difference in the units of measurement.
def raw_effect_size(group1, group2, confidence=0.95):
    """
    Calculate raw effect size with confidence interval.
    """
    n1, n2 = len(group1), len(group2)
    mean1, mean2 = np.mean(group1), np.mean(group2)
    var1, var2 = np.var(group1, ddof=1), np.var(group2, ddof=1)

    # Raw difference
    diff = mean2 - mean1

    # Standard error (Welch)
    se = np.sqrt(var1/n1 + var2/n2)

    # CI
    alpha = 1 - confidence
    t_crit = stats.t.ppf(1 - alpha/2, min(n1, n2) - 1)  # Conservative df
    ci_low = diff - t_crit * se
    ci_high = diff + t_crit * se

    return {
        'difference': diff,
        'se': se,
        'ci': (ci_low, ci_high),
        'relative_change': diff / mean1 * 100 if mean1 != 0 else None
    }


# Example: Revenue per user
np.random.seed(42)
control_revenue = np.random.exponential(50, 500) + 20
treatment_revenue = np.random.exponential(50, 500) + 25  # $5 lift

result = raw_effect_size(control_revenue, treatment_revenue)

print("Raw Effect Size (Revenue):")
print("-" * 40)
print(f"Control mean: ${np.mean(control_revenue):.2f}")
print(f"Treatment mean: ${np.mean(treatment_revenue):.2f}")
print(f"Difference: ${result['difference']:.2f}")
print(f"95% CI: [${result['ci'][0]:.2f}, ${result['ci'][1]:.2f}]")
print(f"Relative change: {result['relative_change']:.1f}%")
Cohen's d
Standardized mean difference: effect expressed in standard deviation units.
def cohens_d(group1, group2, pooled=True):
    """
    Calculate Cohen's d (standardized mean difference).

    pooled=True: Use pooled SD (assumes equal variance)
    pooled=False: Use control group SD (Glass's delta)
    """
    n1, n2 = len(group1), len(group2)
    mean1, mean2 = np.mean(group1), np.mean(group2)
    var1, var2 = np.var(group1, ddof=1), np.var(group2, ddof=1)

    if pooled:
        # Pooled standard deviation
        s_pooled = np.sqrt(((n1-1)*var1 + (n2-1)*var2) / (n1 + n2 - 2))
        d = (mean2 - mean1) / s_pooled
    else:
        # Glass's delta (uses control SD)
        d = (mean2 - mean1) / np.sqrt(var1)

    # Effect size CI (approximate)
    se_d = np.sqrt((n1 + n2) / (n1 * n2) + d**2 / (2 * (n1 + n2)))
    ci_low = d - 1.96 * se_d
    ci_high = d + 1.96 * se_d

    return {
        'd': d,
        'se': se_d,
        'ci': (ci_low, ci_high),
        'interpretation': interpret_d(d)
    }


def interpret_d(d):
    """Cohen's conventional benchmarks."""
    d_abs = abs(d)
    if d_abs < 0.2:
        return "negligible"
    elif d_abs < 0.5:
        return "small"
    elif d_abs < 0.8:
        return "medium"
    else:
        return "large"


# Example
np.random.seed(42)
control = np.random.normal(100, 15, 50)
treatment = np.random.normal(108, 15, 50)  # 8 point improvement

result = cohens_d(control, treatment)

print("Cohen's d:")
print("-" * 40)
print(f"d = {result['d']:.3f}")
print(f"95% CI: [{result['ci'][0]:.3f}, {result['ci'][1]:.3f}]")
print(f"Interpretation: {result['interpretation']}")
Hedges' g: Corrected for Small Samples
def hedges_g(group1, group2):
    """
    Hedges' g: bias-corrected Cohen's d for small samples.
    """
    n1, n2 = len(group1), len(group2)
    d_result = cohens_d(group1, group2)
    d = d_result['d']

    # Correction factor (approximately)
    correction = 1 - 3 / (4 * (n1 + n2) - 9)
    g = d * correction

    return {
        'd': d,
        'g': g,
        'correction_factor': correction,
        'note': 'g < d for small samples; converges as n → ∞'
    }


# Small sample example
np.random.seed(42)
small_control = np.random.normal(100, 15, 15)
small_treatment = np.random.normal(110, 15, 15)

result = hedges_g(small_control, small_treatment)
print(f"Cohen's d: {result['d']:.3f}")
print(f"Hedges' g: {result['g']:.3f}")
print(f"Correction: {result['correction_factor']:.3f}")
Effect Sizes for Proportions
Risk Difference (Absolute)
def risk_difference(successes1, n1, successes2, n2, confidence=0.95):
    """
    Absolute risk difference with CI.
    """
    p1 = successes1 / n1
    p2 = successes2 / n2

    diff = p2 - p1

    # Standard error
    se = np.sqrt(p1*(1-p1)/n1 + p2*(1-p2)/n2)

    # CI
    z = stats.norm.ppf(1 - (1 - confidence)/2)
    ci_low = diff - z * se
    ci_high = diff + z * se

    return {
        'p1': p1,
        'p2': p2,
        'risk_difference': diff,
        'se': se,
        'ci': (ci_low, ci_high),
        'nnt': 1/abs(diff) if diff != 0 else float('inf')  # Number needed to treat
    }


# Example: Conversion rates
control_conversions = 150
control_n = 1000
treatment_conversions = 180
treatment_n = 1000

result = risk_difference(control_conversions, control_n,
                         treatment_conversions, treatment_n)

print("Risk Difference (Conversion Rate):")
print("-" * 40)
print(f"Control rate: {result['p1']:.1%}")
print(f"Treatment rate: {result['p2']:.1%}")
print(f"Absolute difference: {result['risk_difference']:.1%}")
print(f"95% CI: [{result['ci'][0]:.1%}, {result['ci'][1]:.1%}]")
print(f"NNT: {result['nnt']:.0f} (users to treat for 1 additional conversion)")
Risk Ratio (Relative Risk)
def risk_ratio(successes1, n1, successes2, n2, confidence=0.95):
    """
    Relative risk with CI.
    """
    p1 = successes1 / n1
    p2 = successes2 / n2

    rr = p2 / p1 if p1 > 0 else float('inf')

    # SE of log(RR)
    se_log = np.sqrt(1/successes1 - 1/n1 + 1/successes2 - 1/n2)

    # CI on log scale, then transform
    z = stats.norm.ppf(1 - (1 - confidence)/2)
    ci_low = np.exp(np.log(rr) - z * se_log)
    ci_high = np.exp(np.log(rr) + z * se_log)

    return {
        'p1': p1,
        'p2': p2,
        'risk_ratio': rr,
        'ci': (ci_low, ci_high),
        'interpretation': f"Treatment is {rr:.2f}x the rate of control"
    }


result = risk_ratio(control_conversions, control_n,
                    treatment_conversions, treatment_n)

print("\nRisk Ratio:")
print("-" * 40)
print(f"RR = {result['risk_ratio']:.3f}")
print(f"95% CI: [{result['ci'][0]:.3f}, {result['ci'][1]:.3f}]")
print(f"{result['interpretation']}")
Odds Ratio
def odds_ratio(successes1, n1, successes2, n2, confidence=0.95):
    """
    Odds ratio with CI.
    """
    a = successes2  # Treatment successes
    b = n2 - successes2  # Treatment failures
    c = successes1  # Control successes
    d = n1 - successes1  # Control failures

    OR = (a * d) / (b * c) if b * c > 0 else float('inf')

    # SE of log(OR)
    se_log = np.sqrt(1/a + 1/b + 1/c + 1/d)

    # CI
    z = stats.norm.ppf(1 - (1 - confidence)/2)
    ci_low = np.exp(np.log(OR) - z * se_log)
    ci_high = np.exp(np.log(OR) + z * se_log)

    return {
        'odds_ratio': OR,
        'ci': (ci_low, ci_high),
        'note': 'OR ≈ RR when event is rare (<10%)'
    }


result = odds_ratio(control_conversions, control_n,
                    treatment_conversions, treatment_n)

print("\nOdds Ratio:")
print("-" * 40)
print(f"OR = {result['odds_ratio']:.3f}")
print(f"95% CI: [{result['ci'][0]:.3f}, {result['ci'][1]:.3f}]")
Confidence Intervals
What CIs Actually Mean
def demonstrate_ci_meaning():
    """
    Clarify the correct interpretation of confidence intervals.
    """
Correct interpretation: "If we repeated this study many times, 95% of the resulting CIs would contain the true parameter." Or: "We are 95% confident that this interval captures the true effect."
Incorrect interpretations:
- "There is a 95% probability the true value is in this interval" (the true value is fixed; it either is or isn't in the interval)
- "95% of the data falls in this interval" (CIs are about parameter estimates, not data)
Practical use:
- If the CI excludes 0 (for differences) → statistically significant
- If the CI excludes 1 (for ratios) → statistically significant
- Width of the CI shows precision of the estimate
- CI bounds help assess practical significance
CI vs. P-Value Relationship
def ci_pvalue_relationship():
    """
    Show the relationship between CIs and p-values.
    """
    np.random.seed(42)

    # Generate some data
    control = np.random.normal(100, 20, 50)
    treatment = np.random.normal(110, 20, 50)

    diff = np.mean(treatment) - np.mean(control)
    se = np.sqrt(np.var(control, ddof=1)/50 + np.var(treatment, ddof=1)/50)

    # P-value from t-test
    _, p = stats.ttest_ind(control, treatment)

    # 95% CI
    ci_95 = (diff - 1.96*se, diff + 1.96*se)

    # 99% CI
    ci_99 = (diff - 2.58*se, diff + 2.58*se)

    print("CI and P-Value Relationship:")
    print("-" * 50)
    print(f"Mean difference: {diff:.2f}")
    print(f"Standard error: {se:.2f}")
    print()
    print(f"95% CI: [{ci_95[0]:.2f}, {ci_95[1]:.2f}]")
    print(f"  → 0 {'NOT ' if ci_95[0] > 0 or ci_95[1] < 0 else ''}in CI")
    print()
    print(f"P-value: {p:.4f}")
    print(f"  → P {'<' if p < 0.05 else '>'} 0.05")
    print()
    print("Key relationship:")
    print("  - 95% CI excludes 0 ⟺ p < 0.05")
    print("  - 99% CI excludes 0 ⟺ p < 0.01")


ci_pvalue_relationship()
Practical vs. Statistical Significance
The Problem
def practical_vs_statistical():
    """
    Demonstrate when statistical significance doesn't mean practical importance.
    """
    print("STATISTICAL vs. PRACTICAL SIGNIFICANCE")
    print("=" * 60)
    print()

    scenarios = [
        {
            'name': 'Large n, tiny effect (MISLEADING)',
            'n': 100000,
            'true_diff': 0.5,  # Half a point on 100-point scale
            'sd': 15,
            'business_context': 'Customer satisfaction (0-100 scale)'
        },
        {
            'name': 'Small n, large effect (REAL)',
            'n': 50,
            'true_diff': 10,  # 10 points
            'sd': 15,
            'business_context': 'Customer satisfaction (0-100 scale)'
        }
    ]

    for scenario in scenarios:
        np.random.seed(42)

        control = np.random.normal(75, scenario['sd'], scenario['n'])
        treatment = np.random.normal(75 + scenario['true_diff'], scenario['sd'], scenario['n'])

        _, p = stats.ttest_ind(control, treatment)
        d = (np.mean(treatment) - np.mean(control)) / scenario['sd']

        print(f"\n{scenario['name']}:")
        print(f"  Context: {scenario['business_context']}")
        print(f"  n = {scenario['n']:,} per group")
        print(f"  True difference: {scenario['true_diff']} points")
        print(f"  P-value: {p:.6f} ({'significant' if p < 0.05 else 'not significant'})")
        print(f"  Cohen's d: {d:.3f}")
        print()
        if scenario['true_diff'] < 1:
            print("  → Statistically significant but PRACTICALLY MEANINGLESS")
            print("    (Who cares about 0.5 points on a 100-point scale?)")
        else:
            print("  → May not reach significance but PRACTICALLY IMPORTANT")
            print("    (10 points is a real improvement)")


practical_vs_statistical()
Establishing Practical Significance
Business impact:
- What effect size would change a decision?
- What's the ROI threshold for implementation?
- What would stakeholders consider "worth it"?
Context:
- What are typical effect sizes in this domain?
- What have similar interventions achieved?
- What's the natural variability?
Costs:
- Implementation cost of the change
- Opportunity cost of running the experiment
- Risk of wrong decision
Example thresholds:
- E-commerce conversion: Meaningful if > 0.5% absolute lift (e.g., 3.0% → 3.5%). This covers implementation cost.
- SaaS retention: Meaningful if > 1% absolute improvement. High LTV makes small differences valuable.
- User engagement: Meaningful if > 5% relative change. Engagement is noisy; small changes could be artifacts.
Reporting Best Practices
Complete Effect Size Report
def complete_effect_report(control, treatment, metric_name="outcome",
                           mde=None, alpha=0.05):
    """
    Generate a complete effect size report.
    """
    n1, n2 = len(control), len(treatment)
    mean1, mean2 = np.mean(control), np.mean(treatment)

    # Statistical test
    t_stat, p_value = stats.ttest_ind(control, treatment)

    # Raw effect
    diff = mean2 - mean1
    se = np.sqrt(np.var(control, ddof=1)/n1 + np.var(treatment, ddof=1)/n2)
    ci_low, ci_high = diff - 1.96*se, diff + 1.96*se

    # Relative effect
    relative = diff / mean1 * 100 if mean1 != 0 else None

    # Standardized effect
    pooled_sd = np.sqrt(((n1-1)*np.var(control, ddof=1) + (n2-1)*np.var(treatment, ddof=1)) / (n1+n2-2))
    d = diff / pooled_sd

    print("=" * 60)
    print(f"EFFECT SIZE REPORT: {metric_name}")
    print("=" * 60)

    print(f"\nSAMPLE:")
    print(f"  Control: n = {n1}, mean = {mean1:.3f}, SD = {np.std(control, ddof=1):.3f}")
    print(f"  Treatment: n = {n2}, mean = {mean2:.3f}, SD = {np.std(treatment, ddof=1):.3f}")

    print(f"\nEFFECT SIZE:")
    print(f"  Raw difference: {diff:.3f} [{ci_low:.3f}, {ci_high:.3f}]")
    if relative:
        print(f"  Relative change: {relative:+.2f}%")
    print(f"  Cohen's d: {d:.3f} ({interpret_d(d)})")

    print(f"\nSIGNIFICANCE:")
    print(f"  P-value: {p_value:.4f}")
    sig = "Yes" if p_value < alpha else "No"
    print(f"  Statistically significant (α={alpha}): {sig}")

    if mde:
        print(f"\nPRACTICAL SIGNIFICANCE:")
        print(f"  Minimum detectable effect: {mde}")
        prac_sig = "Yes" if abs(diff) >= mde else "No"
        print(f"  Practically significant: {prac_sig}")

    print(f"\nINTERPRETATION:")
    if p_value < alpha and abs(d) > 0.2:
        print(f"  ✓ Both statistically and meaningfully significant")
    elif p_value < alpha:
        print(f"  ⚠ Statistically significant but effect is small (d={d:.2f})")
    elif abs(d) > 0.2:
        print(f"  ⚠ Meaningful effect but not statistically significant (need more data)")
    else:
        print(f"  No significant or meaningful effect detected")

    print("\n" + "=" * 60)


# Example
np.random.seed(42)
control = np.random.normal(50, 10, 200)
treatment = np.random.normal(53, 10, 200)

complete_effect_report(control, treatment, "Revenue per User", mde=2.0)
Reporting Template
For stakeholders:
"Treatment increased [METRIC] by [DIFF] [UNITS] (95% CI: [CI_LOW] to [CI_HIGH]). This represents a [REL%]% improvement over control. The effect is [statistically significant / not significant] (p = [P_VALUE]) and [practically meaningful / not meaningful] based on our pre-defined threshold of [MDE]."
For technical documentation:
- Control (n = [N1]): M = [M1], SD = [SD1]
- Treatment (n = [N2]): M = [M2], SD = [SD2]
- Mean difference: [DIFF] (95% CI: [CI_LOW], [CI_HIGH])
- Cohen's d: [D] (95% CI: [D_CI_LOW], [D_CI_HIGH])
- t([DF]) = [T], p = [P]
For meta-analysis:
- Effect size: d = [D] (SE = [SE_D]) or r = [R] (SE = [SE_R])
- Sample size: N = [TOTAL_N]
Common Effect Size Measures Summary
Mean differences:
| Measure | Formula | Interpretation | Best for |
|---|---|---|---|
| Raw difference | M₂ - M₁ | Actual units | Communicating to stakeholders |
| Cohen's d | (M₂ - M₁) / SD_pooled | Standard deviation units | Comparing across studies |
| Hedges' g | d × correction factor | Bias-corrected d | Small samples, meta-analysis |
Proportions:
| Measure | Formula | Interpretation | Best for |
|---|---|---|---|
| Risk difference | p₂ - p₁ | Absolute change in probability | Communicating absolute impact |
| Risk ratio | p₂ / p₁ | How many times more likely | Rare events |
| Odds ratio | (a×d) / (b×c) | Ratio of odds | Logistic regression, case-control |
Correlations:
| Measure | Formula | Interpretation | Best for |
|---|---|---|---|
| r | Correlation coefficient | -1 to 1, strength of linear relationship | Continuous variables |
| r² | r² | Variance explained | Regression context |
R Implementation
# Complete effect size analysis in R

library(effectsize)
library(rstatix)

effect_size_report <- function(control, treatment) {
  # Basic stats
  cat("EFFECT SIZE REPORT\n")
  cat(rep("=", 50), "\n\n")

  # T-test with effect size
  test <- t.test(treatment, control)
  d <- cohens_d(treatment, control)

  cat("Sample:\n")
  cat(sprintf("  Control: n=%d, M=%.2f, SD=%.2f\n",
              length(control), mean(control), sd(control)))
  cat(sprintf("  Treatment: n=%d, M=%.2f, SD=%.2f\n",
              length(treatment), mean(treatment), sd(treatment)))

  cat("\nEffect Size:\n")
  cat(sprintf("  Raw difference: %.3f [%.3f, %.3f]\n",
              mean(treatment) - mean(control),
              test$conf.int[1], test$conf.int[2]))
  cat(sprintf("  Cohen's d: %.3f [%.3f, %.3f]\n",
              d$Cohens_d, d$CI_low, d$CI_high))

  cat("\nSignificance:\n")
  cat(sprintf("  t(%.1f) = %.3f, p = %.4f\n",
              test$parameter, test$statistic, test$p.value))

  # Interpretation
  cat("\nInterpretation:\n")
  cat(sprintf("  %s effect\n", interpret_cohens_d(d$Cohens_d)))
}

# Example usage:
# control <- rnorm(100, 50, 10)
# treatment <- rnorm(100, 55, 10)
# effect_size_report(control, treatment)
Related Articles
Supporting Articles in This Cluster
- P-Value vs. Confidence Interval — Understanding both together
- Effect Sizes for Mean Differences — Cohen's d, Hedges' g, raw
- Effect Sizes for Proportions — Risk difference, RR, OR
- Practical Significance Thresholds — Setting meaningful thresholds
- CIs for Non-Normal Metrics — Bootstrap CIs
- When CIs and P-Values Disagree — Resolving conflicts
- Reporting Templates — Communicating results
- Power Analysis Guide — Planning for adequate power
Related Pillar Articles
- A/B Testing Statistical Methods — Effect sizes in experiments
- Regression for Analysts — Regression coefficients as effect sizes
Key Takeaway
Effect sizes quantify the magnitude of effects, answering "how big" rather than "does it exist." Confidence intervals provide ranges of plausible effect sizes with uncertainty quantified. The critical insight: statistical significance () tells you nothing about practical importance. Always pair p-values with effect sizes and confidence intervals, and establish thresholds for practical significance before analyzing. The combination of effect size, confidence interval, and practical threshold gives you the complete picture.
References
- https://www.jstor.org/stable/1165312
- https://doi.org/10.1037/a0024338
- https://www.jstor.org/stable/3802789
- Cohen, J. (1988). *Statistical Power Analysis for the Behavioral Sciences* (2nd ed.). Lawrence Erlbaum Associates.
- Cumming, G. (2014). The new statistics: Why and how. *Psychological Science*, 25(1), 7-29.
- Lakens, D. (2013). Calculating and reporting effect sizes to facilitate cumulative science: a practical primer for t-tests and ANOVAs. *Frontiers in Psychology*, 4, 863.
- Sullivan, G. M., & Feinn, R. (2012). Using effect size—or why the p value is not enough. *Journal of Graduate Medical Education*, 4(3), 279-282.
Frequently Asked Questions
What's the difference between statistical and practical significance?
Should I report Cohen's d or raw differences?
What's a 'good' effect size?
Key Takeaway
Effect sizes quantify the magnitude of effects, answering 'how big' rather than 'does it exist.' Confidence intervals provide ranges of plausible effect sizes with uncertainty quantified. The key insight: statistical significance (p < 0.05) tells you nothing about practical importance. Always pair p-values with effect sizes and confidence intervals, and establish thresholds for practical significance before analyzing.