Contents
Confidence Intervals for Non-Normal Metrics: Bootstrap Methods
How to construct confidence intervals when your data isn't normal. Covers percentile, BCa, and studentized bootstrap methods with practical guidance on when each works best.
Quick Hits
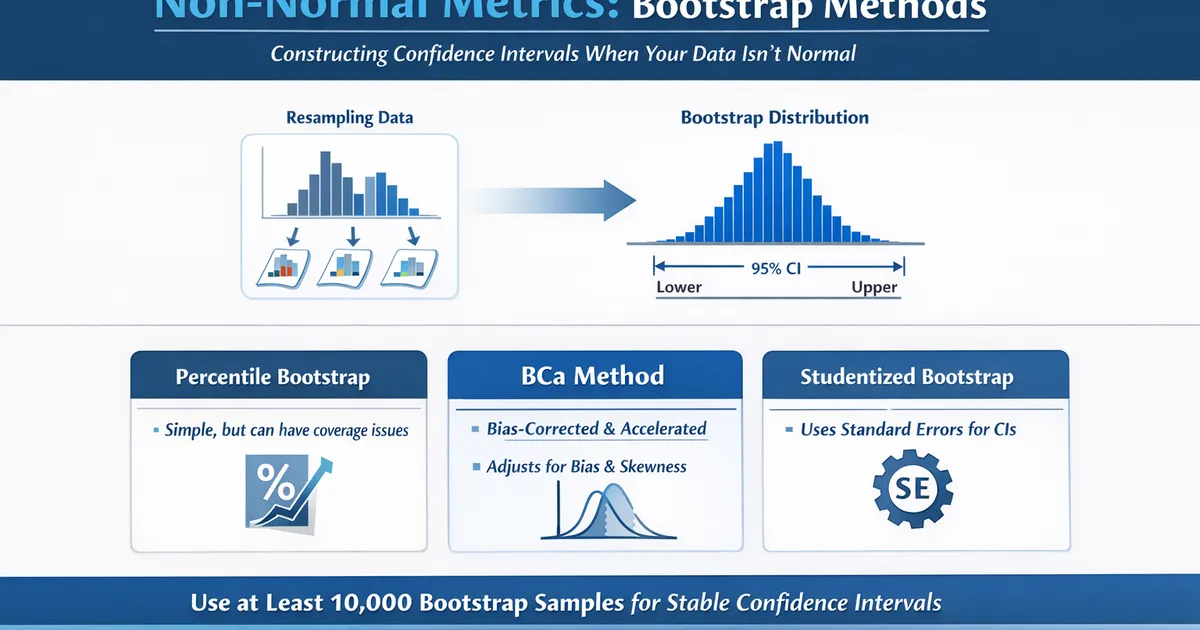
- •Bootstrap resamples your data to estimate sampling distribution
- •Percentile bootstrap is simple but can have coverage issues
- •BCa (bias-corrected accelerated) improves coverage for skewed data
- •Use at least 10,000 bootstrap samples for stable CIs
TL;DR
Bootstrap constructs confidence intervals by resampling your data with replacement, building an empirical sampling distribution. Percentile bootstrap is simple: take the 2.5th and 97.5th percentiles of bootstrap estimates. BCa bootstrap improves on this with bias and acceleration corrections. Use bootstrap when data is skewed, heavy-tailed, or when you're estimating complex statistics like medians or ratios.
Why Bootstrap?
When Normal-Theory CIs Fail
import numpy as np
from scipy import stats

def demonstrate_ci_failure():
    """
    Show when normal-theory CIs don't work well.
    """
    np.random.seed(42)

    # Highly skewed data (exponential)
    n = 50
    data = np.random.exponential(scale=100, size=n)

    # True mean of exponential is the scale parameter
    true_mean = 100

    # Normal-theory CI
    mean = np.mean(data)
    se = np.std(data, ddof=1) / np.sqrt(n)
    normal_ci = (mean - 1.96*se, mean + 1.96*se)

    # Bootstrap CI (percentile)
    boot_means = [np.mean(np.random.choice(data, n, replace=True))
                  for _ in range(10000)]
    boot_ci = (np.percentile(boot_means, 2.5), np.percentile(boot_means, 97.5))

    print("Normal-Theory CI vs. Bootstrap CI for Skewed Data")
    print("=" * 50)
    print(f"\nData: Exponential distribution (true mean = {true_mean})")
    print(f"Sample: n = {n}")
    print(f"Sample mean: {mean:.1f}")
    print(f"Skewness: {stats.skew(data):.2f}")
    print()
    print(f"Normal-theory CI: [{normal_ci[0]:.1f}, {normal_ci[1]:.1f}]")
    print(f"  Width: {normal_ci[1] - normal_ci[0]:.1f}")
    print()
    print(f"Bootstrap CI: [{boot_ci[0]:.1f}, {boot_ci[1]:.1f}]")
    print(f"  Width: {boot_ci[1] - boot_ci[0]:.1f}")
    print()
    print("Note: Bootstrap CI is asymmetric, reflecting the skew")


demonstrate_ci_failure()
What Bootstrap Does
- Resample: Draw n samples WITH replacement from your data (some observations repeat, some are left out).
- Compute: Calculate the statistic on the resampled data.
- Repeat: Do this B times (e.g., 10,000).
- Build distribution: The B statistics form the bootstrap distribution (approximates the sampling distribution).
- Extract CI: Use percentiles of the bootstrap distribution (e.g., 2.5th and 97.5th for a 95% CI).
Why it works:
- The sample is our best guess at the population
- Resampling mimics repeated sampling from the population
- The bootstrap distribution approximates the sampling distribution
Bootstrap Methods
Percentile Bootstrap
The simplest method: use percentiles of bootstrap distribution directly.
def percentile_bootstrap(data, statistic_func, n_bootstrap=10000,
                         confidence=0.95, random_state=None):
    """
    Percentile bootstrap confidence interval.
    """
    if random_state is not None:
        np.random.seed(random_state)

    n = len(data)
    boot_stats = []

    for _ in range(n_bootstrap):
        boot_sample = np.random.choice(data, size=n, replace=True)
        boot_stats.append(statistic_func(boot_sample))

    boot_stats = np.array(boot_stats)

    alpha = 1 - confidence
    ci = (np.percentile(boot_stats, 100 * alpha/2),
          np.percentile(boot_stats, 100 * (1 - alpha/2)))

    return {
        'estimate': statistic_func(data),
        'ci': ci,
        'se': np.std(boot_stats, ddof=1),
        'boot_distribution': boot_stats
    }


# Example: Mean of skewed data
np.random.seed(42)
revenue_data = np.random.exponential(50, 200)

result = percentile_bootstrap(revenue_data, np.mean, random_state=42)

print("PERCENTILE BOOTSTRAP")
print("-" * 40)
print(f"Sample mean: ${result['estimate']:.2f}")
print(f"Bootstrap SE: ${result['se']:.2f}")
print(f"95% CI: [${result['ci'][0]:.2f}, ${result['ci'][1]:.2f}]")
BCa Bootstrap (Bias-Corrected and Accelerated)
Corrects for bias and skewness in the bootstrap distribution.
def bca_bootstrap(data, statistic_func, n_bootstrap=10000,
                  confidence=0.95, random_state=None):
    """
    BCa (bias-corrected accelerated) bootstrap.
    """
    if random_state is not None:
        np.random.seed(random_state)

    n = len(data)
    original = statistic_func(data)

    # Bootstrap distribution
    boot_stats = []
    for _ in range(n_bootstrap):
        boot_sample = np.random.choice(data, size=n, replace=True)
        boot_stats.append(statistic_func(boot_sample))
    boot_stats = np.array(boot_stats)

    # Bias correction factor
    z0 = stats.norm.ppf(np.mean(boot_stats < original))

    # Acceleration factor (jackknife)
    jackknife_stats = []
    for i in range(n):
        jack_sample = np.delete(data, i)
        jackknife_stats.append(statistic_func(jack_sample))
    jackknife_stats = np.array(jackknife_stats)

    jack_mean = np.mean(jackknife_stats)
    num = np.sum((jack_mean - jackknife_stats)**3)
    denom = 6 * (np.sum((jack_mean - jackknife_stats)**2))**1.5
    a = num / denom if denom != 0 else 0

    # Adjusted percentiles
    alpha = 1 - confidence
    z_alpha_low = stats.norm.ppf(alpha/2)
    z_alpha_high = stats.norm.ppf(1 - alpha/2)

    # BCa adjustment formula
    def adjusted_percentile(z_alpha):
        return stats.norm.cdf(z0 + (z0 + z_alpha) / (1 - a*(z0 + z_alpha)))

    p_low = adjusted_percentile(z_alpha_low)
    p_high = adjusted_percentile(z_alpha_high)

    ci = (np.percentile(boot_stats, 100 * p_low),
          np.percentile(boot_stats, 100 * p_high))

    return {
        'estimate': original,
        'ci': ci,
        'bias_correction': z0,
        'acceleration': a,
        'se': np.std(boot_stats, ddof=1)
    }


# Example
result_bca = bca_bootstrap(revenue_data, np.mean, random_state=42)

print("\nBCa BOOTSTRAP")
print("-" * 40)
print(f"Sample mean: ${result_bca['estimate']:.2f}")
print(f"95% CI: [${result_bca['ci'][0]:.2f}, ${result_bca['ci'][1]:.2f}]")
print(f"Bias correction (z0): {result_bca['bias_correction']:.3f}")
print(f"Acceleration (a): {result_bca['acceleration']:.4f}")
Comparison of Methods
def compare_bootstrap_methods(data, statistic_func=np.mean, n_bootstrap=10000):
    """
    Compare different bootstrap CI methods.
    """
    np.random.seed(42)

    # Percentile
    perc = percentile_bootstrap(data, statistic_func, n_bootstrap, random_state=42)

    # BCa
    bca = bca_bootstrap(data, statistic_func, n_bootstrap, random_state=42)

    # Normal theory (for comparison)
    mean = np.mean(data)
    se = np.std(data, ddof=1) / np.sqrt(len(data))
    normal_ci = (mean - 1.96*se, mean + 1.96*se)

    print("BOOTSTRAP METHOD COMPARISON")
    print("=" * 60)
    print(f"\nData skewness: {stats.skew(data):.2f}")
    print()
    print(f"{'Method':<20} {'Lower':>12} {'Upper':>12} {'Width':>12}")
    print("-" * 60)
    print(f"{'Normal-theory':<20} {normal_ci[0]:>12.2f} {normal_ci[1]:>12.2f} "
          f"{normal_ci[1]-normal_ci[0]:>12.2f}")
    print(f"{'Percentile':<20} {perc['ci'][0]:>12.2f} {perc['ci'][1]:>12.2f} "
          f"{perc['ci'][1]-perc['ci'][0]:>12.2f}")
    print(f"{'BCa':<20} {bca['ci'][0]:>12.2f} {bca['ci'][1]:>12.2f} "
          f"{bca['ci'][1]-bca['ci'][0]:>12.2f}")

    return {'normal': normal_ci, 'percentile': perc['ci'], 'bca': bca['ci']}


# Skewed data example
np.random.seed(42)
skewed_data = np.random.exponential(100, 100)
compare_bootstrap_methods(skewed_data)
Practical Applications
Median and Percentiles
def bootstrap_median_ci(data, n_bootstrap=10000, confidence=0.95):
    """
    Bootstrap CI for median.
    """
    return percentile_bootstrap(data, np.median, n_bootstrap, confidence)


def bootstrap_percentile_ci(data, percentile, n_bootstrap=10000, confidence=0.95):
    """
    Bootstrap CI for any percentile.
    """
    return percentile_bootstrap(
        data,
        lambda x: np.percentile(x, percentile),
        n_bootstrap,
        confidence
    )


# Example: p95 latency
np.random.seed(42)
latency_data = np.random.lognormal(mean=4, sigma=0.5, size=500)

median_result = bootstrap_median_ci(latency_data)
p95_result = bootstrap_percentile_ci(latency_data, 95)

print("BOOTSTRAP FOR LATENCY METRICS")
print("-" * 40)
print(f"Median latency: {median_result['estimate']:.1f}ms")
print(f"  95% CI: [{median_result['ci'][0]:.1f}, {median_result['ci'][1]:.1f}]")
print()
print(f"P95 latency: {p95_result['estimate']:.1f}ms")
print(f"  95% CI: [{p95_result['ci'][0]:.1f}, {p95_result['ci'][1]:.1f}]")
Difference in Means (Two Samples)
def bootstrap_two_sample(group1, group2, statistic='mean_diff',
                         n_bootstrap=10000, confidence=0.95):
    """
    Bootstrap CI for difference between two groups.
    """
    np.random.seed(42)

    n1, n2 = len(group1), len(group2)

    def calc_stat(g1, g2):
        if statistic == 'mean_diff':
            return np.mean(g2) - np.mean(g1)
        elif statistic == 'median_diff':
            return np.median(g2) - np.median(g1)
        elif statistic == 'ratio':
            return np.mean(g2) / np.mean(g1) if np.mean(g1) != 0 else np.inf

    original = calc_stat(group1, group2)

    boot_stats = []
    for _ in range(n_bootstrap):
        boot_g1 = np.random.choice(group1, n1, replace=True)
        boot_g2 = np.random.choice(group2, n2, replace=True)
        boot_stats.append(calc_stat(boot_g1, boot_g2))

    boot_stats = np.array(boot_stats)
    alpha = 1 - confidence
    ci = (np.percentile(boot_stats, 100*alpha/2),
          np.percentile(boot_stats, 100*(1-alpha/2)))

    return {
        'estimate': original,
        'ci': ci,
        'se': np.std(boot_stats, ddof=1)
    }


# Example: A/B test with skewed revenue
np.random.seed(42)
control_revenue = np.random.lognormal(4, 1, 500)
treatment_revenue = np.random.lognormal(4.1, 1, 500)

result = bootstrap_two_sample(control_revenue, treatment_revenue)

print("BOOTSTRAP FOR A/B TEST (Revenue)")
print("-" * 40)
print(f"Mean difference: ${result['estimate']:.2f}")
print(f"95% CI: [${result['ci'][0]:.2f}, ${result['ci'][1]:.2f}]")
Ratios and Complex Statistics
def bootstrap_ratio(numerator_data, denominator_data, n_bootstrap=10000):
    """
    Bootstrap CI for a ratio of means.
    """
    np.random.seed(42)

    n = len(numerator_data)

    original_ratio = np.mean(numerator_data) / np.mean(denominator_data)

    boot_ratios = []
    for _ in range(n_bootstrap):
        idx = np.random.choice(n, n, replace=True)
        boot_num = numerator_data[idx]
        boot_denom = denominator_data[idx]
        if np.mean(boot_denom) != 0:
            boot_ratios.append(np.mean(boot_num) / np.mean(boot_denom))

    boot_ratios = np.array(boot_ratios)
    ci = (np.percentile(boot_ratios, 2.5), np.percentile(boot_ratios, 97.5))

    return {
        'ratio': original_ratio,
        'ci': ci,
        'se': np.std(boot_ratios, ddof=1)
    }


# Example: Revenue per session
np.random.seed(42)
revenue = np.random.exponential(20, 1000)
sessions = np.random.poisson(3, 1000) + 1

result = bootstrap_ratio(revenue, sessions)

print("BOOTSTRAP FOR RATIO (Revenue per Session)")
print("-" * 40)
print(f"Ratio: ${result['ratio']:.2f}")
print(f"95% CI: [${result['ci'][0]:.2f}, ${result['ci'][1]:.2f}]")
How Many Bootstrap Samples?
def bootstrap_sample_stability():
    """
    Show how CI stability changes with number of bootstrap samples.
    """
    np.random.seed(42)
    data = np.random.exponential(100, 100)

    b_values = [100, 500, 1000, 2000, 5000, 10000, 20000]

    print("BOOTSTRAP SAMPLE SIZE STABILITY")
    print("=" * 60)
    print()
    print("Running each 10 times to show variability:")
    print()
    print(f"{'B':>8} {'Mean CI Width':>15} {'CI Width SD':>15}")
    print("-" * 40)

    for B in b_values:
        widths = []
        for trial in range(10):
            boot_means = [np.mean(np.random.choice(data, len(data), replace=True))
                         for _ in range(B)]
            ci = (np.percentile(boot_means, 2.5), np.percentile(boot_means, 97.5))
            widths.append(ci[1] - ci[0])

        print(f"{B:>8} {np.mean(widths):>15.2f} {np.std(widths):>15.2f}")

    print()
    print("Recommendation: Use B ≥ 10,000 for stable CIs")


bootstrap_sample_stability()
When to Use Which Method
Percentile bootstrap:
- Use when: quick exploratory analysis, statistics with symmetric distributions, large samples
- Avoid when: highly skewed statistics, small samples, need accurate coverage
BCa bootstrap:
- Use when: skewed data or statistics, need accurate coverage, publication-quality results
- Avoid when: very large datasets (computationally expensive), jackknife is not well-defined for your statistic
Studentized bootstrap:
- Use when: best coverage properties needed, have a good variance estimator
- Avoid when: variance estimation is difficult, computational constraints
R Implementation
# Bootstrap confidence intervals in R

library(boot)

# Define statistic function
mean_func <- function(data, indices) {
  mean(data[indices])
}

# Percentile bootstrap
percentile_ci <- function(data, R = 10000, conf = 0.95) {
  boot_result <- boot(data, mean_func, R = R)
  ci <- boot.ci(boot_result, conf = conf, type = "perc")
  return(ci$percent[4:5])
}

# BCa bootstrap
bca_ci <- function(data, R = 10000, conf = 0.95) {
  boot_result <- boot(data, mean_func, R = R)
  ci <- boot.ci(boot_result, conf = conf, type = "bca")
  return(ci$bca[4:5])
}

# Example
data <- rexp(100, rate = 0.01)

cat("BOOTSTRAP CIs\n")
cat(rep("-", 40), "\n")

perc <- percentile_ci(data)
cat(sprintf("Percentile: [%.2f, %.2f]\n", perc[1], perc[2]))

bca <- bca_ci(data)
cat(sprintf("BCa: [%.2f, %.2f]\n", bca[1], bca[2]))
Related Methods
- Effect Sizes Master Guide — The pillar article
- Bootstrap for Heavy-Tailed Metrics — Advanced bootstrap
- Non-Normal Metrics — Handling skewed data
Key Takeaway
Bootstrap provides valid confidence intervals without assuming normality by resampling your data to approximate the sampling distribution. For most applications, BCa bootstrap is recommended as it corrects for bias and skewness. Use at least 10,000 resamples for stable results. Bootstrap is especially valuable for medians, percentiles, ratios, and any statistics where normal-theory CIs might fail.
References
- https://www.jstor.org/stable/2289144
- https://doi.org/10.1214/ss/1177013815
- Efron, B., & Tibshirani, R. J. (1993). *An Introduction to the Bootstrap*. Chapman & Hall.
- DiCiccio, T. J., & Efron, B. (1996). Bootstrap confidence intervals. *Statistical Science*, 11(3), 189-228.
- Hesterberg, T. C. (2015). What teachers should know about the bootstrap: Resampling in the undergraduate statistics curriculum. *The American Statistician*, 69(4), 371-386.
Frequently Asked Questions
When should I use bootstrap instead of normal-theory CIs?
How many bootstrap samples do I need?
Can bootstrap fix small sample problems?
Key Takeaway
Bootstrap provides valid confidence intervals without assuming normality. For most applications, BCa (bias-corrected accelerated) bootstrap is recommended as it adjusts for both bias and skewness. Use at least 10,000 resamples for stable results. Bootstrap is especially valuable for metrics like medians, percentiles, ratios, and any statistics with complex or unknown sampling distributions.