Contents
Effect Sizes for Proportions: Risk Difference, Risk Ratio, and Odds Ratio
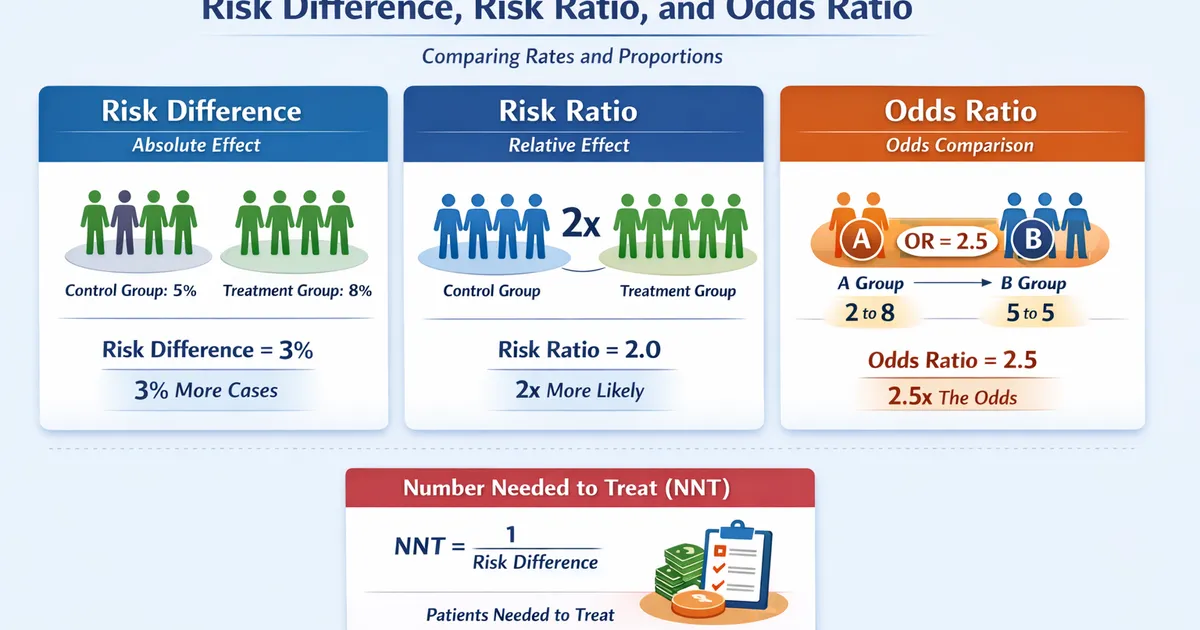
A practical guide to effect sizes when comparing rates and proportions. Learn when to use risk difference vs. risk ratio vs. odds ratio, and how to interpret each correctly.
Quick Hits
- •Risk difference (absolute) tells you how many more per 100 will have the outcome
- •Risk ratio (relative) tells you how many times more likely the outcome is
- •Odds ratio ≈ risk ratio only when event is rare (<10%)
- •Report both absolute and relative effects for complete picture
TL;DR
When comparing proportions, you have three main effect size options: risk difference (absolute: "5% more"), risk ratio (relative: "1.5x more likely"), and odds ratio (from logistic regression). Risk difference is most intuitive for decisions. Risk ratio allows comparison across settings with different baseline rates. Odds ratio approximates risk ratio only when events are rare. Report both absolute and relative effects for the complete picture.
The Three Effect Sizes
Quick Comparison
import numpy as np
from scipy import stats

def compare_effect_measures(p1, p2, n1=1000, n2=1000):
    """
    Compare different effect size measures for proportions.
    """
    # Risk difference (absolute)
    rd = p2 - p1

    # Risk ratio (relative risk)
    rr = p2 / p1 if p1 > 0 else float('inf')

    # Odds ratio
    odds1 = p1 / (1 - p1)
    odds2 = p2 / (1 - p2)
    OR = odds2 / odds1

    # NNT
    nnt = 1 / abs(rd) if rd != 0 else float('inf')

    print(f"Control rate: {p1:.1%}")
    print(f"Treatment rate: {p2:.1%}")
    print("-" * 40)
    print(f"Risk Difference: {rd:+.1%}")
    print(f"  'Treatment is {abs(rd)*100:.1f} percentage points {'higher' if rd > 0 else 'lower'}'")
    print()
    print(f"Risk Ratio: {rr:.2f}")
    print(f"  'Treatment is {rr:.2f}x the rate of control'")
    print()
    print(f"Odds Ratio: {OR:.2f}")
    print(f"  'Odds of outcome in treatment are {OR:.2f}x control'")
    print()
    print(f"NNT: {nnt:.1f}")
    print(f"  'Need to treat {nnt:.0f} people for 1 extra {'success' if rd > 0 else 'prevented failure'}'")

    return {'rd': rd, 'rr': rr, 'or': OR, 'nnt': nnt}


# Example: Conversion rate improvement
print("EXAMPLE: Conversion Rate Experiment")
print("=" * 50)
compare_effect_measures(0.10, 0.12)  # 10% → 12%
Risk Difference (Absolute Risk)
Calculation with CI
def risk_difference(successes1, n1, successes2, n2, confidence=0.95):
    """
    Calculate risk difference with confidence interval.
    """
    p1 = successes1 / n1
    p2 = successes2 / n2

    rd = p2 - p1

    # Standard error
    se = np.sqrt(p1*(1-p1)/n1 + p2*(1-p2)/n2)

    # CI
    z = stats.norm.ppf(1 - (1-confidence)/2)
    ci = (rd - z*se, rd + z*se)

    # NNT
    nnt = 1/abs(rd) if rd != 0 else float('inf')

    return {
        'p1': p1,
        'p2': p2,
        'risk_difference': rd,
        'se': se,
        'ci': ci,
        'nnt': nnt
    }


# Example
result = risk_difference(100, 1000, 130, 1000)

print("RISK DIFFERENCE")
print("-" * 40)
print(f"Control rate: {result['p1']:.1%}")
print(f"Treatment rate: {result['p2']:.1%}")
print(f"Risk difference: {result['risk_difference']:.1%}")
print(f"95% CI: [{result['ci'][0]:.1%}, {result['ci'][1]:.1%}]")
print(f"NNT: {result['nnt']:.1f}")
When to Use Risk Difference
Best for:
- Making decisions about implementation
- Estimating actual impact on users/patients
- Cost-benefit analysis (need actual numbers)
- Communicating to stakeholders
- When baseline rate matters for interpretation
Examples:
- Conversion rate: 12% → 15% = 3pp improvement
- Churn: 8% → 6% = 2pp reduction
- Disease incidence: 5% → 3% = 2pp fewer cases per 100 patients
Risk Ratio (Relative Risk)
Calculation with CI
def risk_ratio(successes1, n1, successes2, n2, confidence=0.95):
    """
    Calculate risk ratio with confidence interval.
    """
    p1 = successes1 / n1
    p2 = successes2 / n2

    rr = p2 / p1 if p1 > 0 else float('inf')

    # SE of log(RR)
    se_log = np.sqrt(1/successes1 - 1/n1 + 1/successes2 - 1/n2)

    # CI (on log scale, then transform)
    z = stats.norm.ppf(1 - (1-confidence)/2)
    log_ci = (np.log(rr) - z*se_log, np.log(rr) + z*se_log)
    ci = (np.exp(log_ci[0]), np.exp(log_ci[1]))

    return {
        'p1': p1,
        'p2': p2,
        'risk_ratio': rr,
        'log_rr': np.log(rr),
        'se_log': se_log,
        'ci': ci
    }


# Example
result = risk_ratio(100, 1000, 130, 1000)

print("RISK RATIO")
print("-" * 40)
print(f"Control rate: {result['p1']:.1%}")
print(f"Treatment rate: {result['p2']:.1%}")
print(f"Risk ratio: {result['risk_ratio']:.3f}")
print(f"95% CI: [{result['ci'][0]:.3f}, {result['ci'][1]:.3f}]")
print()
print(f"Interpretation: Treatment has {result['risk_ratio']:.2f}x the rate")
print(f"  or equivalently: {(result['risk_ratio']-1)*100:.0f}% {'higher' if result['risk_ratio'] > 1 else 'lower'} rate")
When to Use Risk Ratio
Best for:
- Comparing effects across populations with different baselines
- Meta-analyses combining studies
- Relative comparisons ("how many times more likely")
- When baseline rate varies or is uncertain
Caution:
- Can seem misleadingly large with rare events
- RR = 2.0 could mean 0.1% → 0.2% (trivial) or 25% → 50% (huge)
- Always report alongside absolute risk difference
Odds Ratio
Calculation with CI
def odds_ratio(successes1, n1, successes2, n2, confidence=0.95):
    """
    Calculate odds ratio with confidence interval.
    """
    # 2x2 table
    a = successes2  # Treatment success
    b = n2 - successes2  # Treatment failure
    c = successes1  # Control success
    d = n1 - successes1  # Control failure

    OR = (a * d) / (b * c) if b * c > 0 else float('inf')

    # SE of log(OR)
    se_log = np.sqrt(1/a + 1/b + 1/c + 1/d)

    # CI
    z = stats.norm.ppf(1 - (1-confidence)/2)
    log_ci = (np.log(OR) - z*se_log, np.log(OR) + z*se_log)
    ci = (np.exp(log_ci[0]), np.exp(log_ci[1]))

    return {
        'odds_ratio': OR,
        'log_or': np.log(OR),
        'se_log': se_log,
        'ci': ci
    }


# Example
result = odds_ratio(100, 1000, 130, 1000)

print("ODDS RATIO")
print("-" * 40)
print(f"OR: {result['odds_ratio']:.3f}")
print(f"95% CI: [{result['ci'][0]:.3f}, {result['ci'][1]:.3f}]")
Odds Ratio vs. Risk Ratio
def or_vs_rr_comparison():
    """
    Show when OR approximates RR and when it doesn't.
    """
    print("ODDS RATIO vs. RISK RATIO")
    print("=" * 60)
    print()
    print("When OR ≈ RR: When outcome is RARE (< 10%)")
    print("When OR ≠ RR: When outcome is COMMON (> 10%)")
    print()

    scenarios = [
        (0.02, 0.04, "Rare event (2% → 4%)"),
        (0.10, 0.15, "Moderate event (10% → 15%)"),
        (0.30, 0.45, "Common event (30% → 45%)"),
        (0.50, 0.65, "Very common (50% → 65%)")
    ]

    print(f"{'Scenario':<30} {'RR':>8} {'OR':>8} {'Difference':>12}")
    print("-" * 60)

    for p1, p2, label in scenarios:
        rr = p2 / p1
        odds1 = p1 / (1 - p1)
        odds2 = p2 / (1 - p2)
        OR = odds2 / odds1
        diff_pct = (OR - rr) / rr * 100

        print(f"{label:<30} {rr:>8.2f} {OR:>8.2f} {diff_pct:>+11.0f}%")

    print()
    print("Key insight: OR always farther from 1 than RR")
    print("For common outcomes, OR overstates the effect!")


or_vs_rr_comparison()
When to Use Odds Ratio
Appropriate uses:
- Output from logistic regression
- Case-control studies
- When you need symmetry (OR for Y = 1/OR for not-Y)
- Rare events (where OR ≈ RR anyway)
Avoid when:
- Communicating to non-statisticians
- When outcome is common (OR overstates effect)
- When you want direct probability interpretation
Number Needed to Treat (NNT)
Understanding NNT
NNT = 1 / |Risk Difference|. Interpretation: "How many people must receive treatment for one additional person to benefit?"
Examples:
- Conversion optimization: Control 10.0% → Treatment 12.0%. RD = 2.0%. NNT = 50 users to convert 1 extra.
- Churn reduction: Control 8.0% → Treatment 6.0%. RD = -2.0%. NNT = 50 users to prevent 1 churn.
- Click-through rate: Control 2.0% → Treatment 2.5%. RD = 0.5%. NNT = 200 impressions for 1 extra click.
def nnt_with_ci(successes1, n1, successes2, n2):
    """
    NNT with confidence interval.
    """
    result = risk_difference(successes1, n1, successes2, n2)
    rd = result['risk_difference']
    rd_ci = result['ci']

    nnt = 1/abs(rd) if rd != 0 else float('inf')

    # CI for NNT (note: inverts the order)
    # If RD CI is (a, b), NNT CI is (1/b, 1/a) when both same sign
    if rd_ci[0] * rd_ci[1] > 0:  # Same sign
        nnt_ci = (1/abs(rd_ci[1]), 1/abs(rd_ci[0]))
    else:  # Crosses zero - NNT not meaningful
        nnt_ci = (float('inf'), float('inf'))

    return {
        'nnt': nnt,
        'nnt_ci': nnt_ci,
        'rd': rd,
        'rd_ci': rd_ci
    }
Complete Analysis
def complete_proportion_analysis(successes1, n1, successes2, n2,
                                 group1_name="Control", group2_name="Treatment"):
    """
    Complete analysis of proportion comparison.
    """
    p1, p2 = successes1/n1, successes2/n2

    # Calculate all measures
    rd_result = risk_difference(successes1, n1, successes2, n2)
    rr_result = risk_ratio(successes1, n1, successes2, n2)
    or_result = odds_ratio(successes1, n1, successes2, n2)

    print("=" * 60)
    print("PROPORTION COMPARISON ANALYSIS")
    print("=" * 60)

    print(f"\nSAMPLE:")
    print(f"  {group1_name}: {successes1}/{n1} = {p1:.1%}")
    print(f"  {group2_name}: {successes2}/{n2} = {p2:.1%}")

    print(f"\nEFFECT SIZES:")
    print("-" * 40)

    print(f"\n1. Risk Difference (Absolute)")
    print(f"   RD = {rd_result['risk_difference']:+.1%}")
    print(f"   95% CI: [{rd_result['ci'][0]:.1%}, {rd_result['ci'][1]:.1%}]")
    print(f"   Interpretation: {group2_name} is {abs(rd_result['risk_difference'])*100:.1f}")
    print(f"   percentage points {'higher' if rd_result['risk_difference'] > 0 else 'lower'}")

    print(f"\n2. Risk Ratio (Relative)")
    print(f"   RR = {rr_result['risk_ratio']:.3f}")
    print(f"   95% CI: [{rr_result['ci'][0]:.3f}, {rr_result['ci'][1]:.3f}]")
    print(f"   Interpretation: {group2_name} is {rr_result['risk_ratio']:.2f}x the rate")

    print(f"\n3. Odds Ratio")
    print(f"   OR = {or_result['odds_ratio']:.3f}")
    print(f"   95% CI: [{or_result['ci'][0]:.3f}, {or_result['ci'][1]:.3f}]")

    print(f"\n4. Number Needed to Treat")
    nnt = rd_result['nnt']
    print(f"   NNT = {nnt:.1f}")
    print(f"   Interpretation: Treat {nnt:.0f} to get 1 additional success")

    print(f"\nSIGNIFICANCE:")
    if rd_result['ci'][0] * rd_result['ci'][1] > 0:
        print(f"   ✓ Statistically significant (CI excludes 0)")
    else:
        print(f"   ✗ Not statistically significant (CI includes 0)")

    # Note about OR vs RR
    or_rr_diff = abs(or_result['odds_ratio'] - rr_result['risk_ratio']) / rr_result['risk_ratio'] * 100
    print(f"\nNOTE ON OR vs RR:")
    if or_rr_diff > 10:
        print(f"   ⚠ OR and RR differ by {or_rr_diff:.0f}%")
        print(f"   Event rate ({max(p1, p2):.0%}) is high; OR overstates effect")
    else:
        print(f"   OR ≈ RR (event is relatively rare)")

    print("\n" + "=" * 60)


# Example: A/B test
complete_proportion_analysis(
    successes1=1000, n1=10000,  # 10% conversion
    successes2=1150, n2=10000,  # 11.5% conversion
    group1_name="Control",
    group2_name="Treatment"
)
R Implementation
# Proportion effect sizes in R

library(epitools)
library(fmsb)

proportion_analysis <- function(a, b, c, d) {
  # a = treatment success, b = treatment failure
  # c = control success, d = control failure

  n1 <- c + d  # Control total
  n2 <- a + b  # Treatment total
  p1 <- c / n1
  p2 <- a / n2

  cat("PROPORTION ANALYSIS\n")
  cat(rep("=", 50), "\n\n")

  cat(sprintf("Control: %d/%d = %.1f%%\n", c, n1, p1*100))
  cat(sprintf("Treatment: %d/%d = %.1f%%\n", a, n2, p2*100))

  # Risk difference
  rd <- p2 - p1
  se_rd <- sqrt(p1*(1-p1)/n1 + p2*(1-p2)/n2)
  rd_ci <- c(rd - 1.96*se_rd, rd + 1.96*se_rd)

  cat("\nRisk Difference:\n")
  cat(sprintf("  RD = %.1f%% [%.1f%%, %.1f%%]\n",
              rd*100, rd_ci[1]*100, rd_ci[2]*100))

  # Risk ratio
  rr <- riskratio(matrix(c(a, b, c, d), nrow = 2, byrow = TRUE))
  cat("\nRisk Ratio:\n")
  cat(sprintf("  RR = %.3f [%.3f, %.3f]\n",
              rr$measure[2,1], rr$measure[2,2], rr$measure[2,3]))

  # Odds ratio
  or <- oddsratio(matrix(c(a, b, c, d), nrow = 2, byrow = TRUE))
  cat("\nOdds Ratio:\n")
  cat(sprintf("  OR = %.3f [%.3f, %.3f]\n",
              or$measure[2,1], or$measure[2,2], or$measure[2,3]))

  # NNT
  nnt <- 1/abs(rd)
  cat("\nNNT:\n")
  cat(sprintf("  NNT = %.1f\n", nnt))
}

# Usage:
# proportion_analysis(a=115, b=885, c=100, d=900)
Summary Table
| Measure | Formula | Interpretation | Best For |
|---|---|---|---|
| Risk Difference | p₂ - p₁ | Absolute change in probability | Decisions, impact assessment |
| Risk Ratio | p₂ / p₁ | How many times more likely | Cross-study comparison |
| Odds Ratio | Ratio of odds | Logistic regression, case-control | |
| NNT | 1/ | RD |
Related Methods
- Effect Sizes Master Guide — The pillar article
- Effect Sizes for Means — Cohen's d, Hedges' g
- Choosing Test for Conversion Rate — Testing proportions
Key Takeaway
For comparing proportions, report both absolute (risk difference) and relative (risk ratio) effects. Risk difference shows actual impact ("3 more per 100"), while risk ratio enables comparisons across contexts. Odds ratios come from logistic regression but overstate effects when outcomes are common. NNT (1/risk difference) is highly intuitive for decision-making. Always include confidence intervals to show uncertainty.
References
- https://www.jstor.org/stable/2531734
- https://doi.org/10.1136/bmj.317.7166.1155
- Altman, D. G., Deeks, J. J., & Sackett, D. L. (1998). Odds ratios should be avoided when events are common. *BMJ*, 317(7168), 1318.
- Zhang, J., & Kai, F. Y. (1998). What's the relative risk? A method of correcting the odds ratio in cohort studies of common outcomes. *JAMA*, 280(19), 1690-1691.
- Laupacis, A., Sackett, D. L., & Roberts, R. S. (1988). An assessment of clinically useful measures of the consequences of treatment. *New England Journal of Medicine*, 318(26), 1728-1733.
Frequently Asked Questions
When should I use risk difference vs. risk ratio?
Why do medical studies often report odds ratios?
What's Number Needed to Treat (NNT)?
Key Takeaway
For proportions, risk difference shows absolute impact ('3 more conversions per 100 users'), risk ratio shows relative impact ('1.2x more likely'), and odds ratio comes from logistic regression. Risk difference is most interpretable for decisions; risk ratio allows cross-context comparisons. Always report confidence intervals, and consider NNT for practical interpretation.