Contents
Choosing the Right Test for Conversion Rates: Z-Test, Chi-Square, or Fisher's Exact
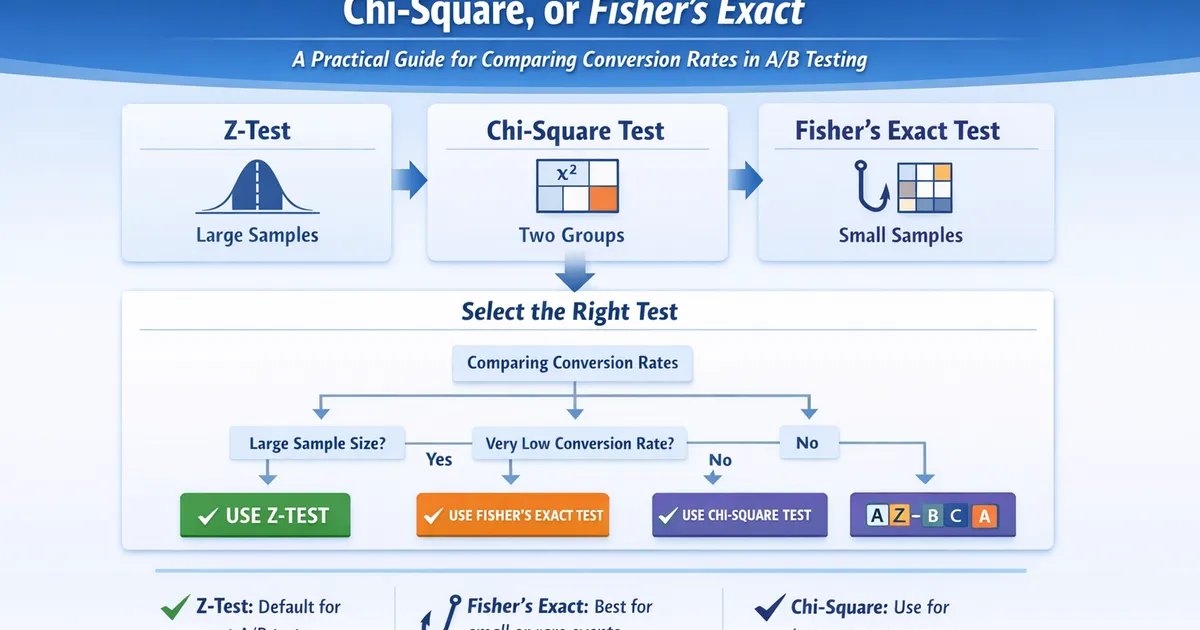
A practical decision framework for selecting between z-test, chi-square test, and Fisher's exact test when comparing conversion rates in A/B experiments.
Quick Hits
- •The two-proportion z-test handles 90% of conversion rate experiments—it's your default choice
- •Fisher's exact test is only necessary for small samples (n < 1,000) or extreme rates (< 1%)
- •Chi-square and z-test give identical results for two groups—z² = χ²
- •All three tests answer the same question, just with different computational approaches
TL;DR
Three tests dominate conversion rate comparisons: the two-proportion z-test, chi-square test, and Fisher's exact test. For typical A/B tests with thousands of users, they give nearly identical results. The z-test is your default. Fisher's exact handles small samples. Chi-square scales to multiple variants. This guide explains when each applies and why it often doesn't matter which you choose.
The Core Question All Three Tests Answer
You ran an A/B test. Control had 500 conversions out of 10,000 visitors (5.0%). Treatment had 550 conversions out of 10,000 visitors (5.5%). Is that 0.5 percentage point difference real, or just random noise?
All three tests formalize this question as a hypothesis test:
- H₀ (null): Both groups have the same true conversion rate
- H₁ (alternative): The conversion rates differ
The p-value tells you: if there were no true difference, how often would you see a gap this large or larger by chance alone?
Two-Proportion Z-Test: The Workhorse
The z-test is the most commonly used method for conversion rate experiments. It works by assuming that with large enough samples, the difference in proportions follows a normal distribution.
The Math
The test statistic is:
Where:
- are the observed conversion rates
- is the pooled proportion
- are the sample sizes
Python Implementation
from statsmodels.stats.proportion import proportions_ztest
import numpy as np

# Example: 500/10000 control vs 550/10000 treatment
conversions = np.array([500, 550])
sample_sizes = np.array([10000, 10000])

z_stat, p_value = proportions_ztest(conversions, sample_sizes, alternative='two-sided')

print(f"Z-statistic: {z_stat:.4f}")
print(f"P-value: {p_value:.4f}")
# Output: Z-statistic: -1.5430, P-value: 0.1228
R Implementation
# Two-proportion z-test in R
prop.test(c(500, 550), c(10000, 10000), correct = FALSE)

# Or using the formula directly
z_test_proportions <- function(x1, n1, x2, n2) {
  p1 <- x1 / n1
  p2 <- x2 / n2
  p_pool <- (x1 + x2) / (n1 + n2)

  z <- (p1 - p2) / sqrt(p_pool * (1 - p_pool) * (1/n1 + 1/n2))
  p_value <- 2 * pnorm(-abs(z))

  list(z = z, p_value = p_value)
}

z_test_proportions(500, 10000, 550, 10000)
When It Works
The z-test relies on the normal approximation to the binomial distribution. This approximation is valid when:
- Each group has at least 5 successes AND 5 failures
- Sample sizes are reasonably large (typically n > 30 per group)
For most A/B tests with thousands of users, these conditions are easily met.
Chi-Square Test: The Generalizable Sibling
The chi-square test compares observed frequencies to expected frequencies under the null hypothesis. For two groups, it's mathematically equivalent to the z-test (χ² = z²).
The Math
Where is observed count and is expected count under the null.
For a table (two groups, binary outcome), there's a single degree of freedom, and the chi-square statistic equals the square of the z-statistic.
Python Implementation
from scipy.stats import chi2_contingency
import numpy as np

# Create contingency table
#           Converted  Not Converted
# Control     500        9500
# Treatment   550        9450
table = np.array([[500, 9500],
                  [550, 9450]])

chi2, p_value, dof, expected = chi2_contingency(table, correction=False)

print(f"Chi-square: {chi2:.4f}")
print(f"P-value: {p_value:.4f}")
print(f"Degrees of freedom: {dof}")
# Output: Chi-square: 2.3809, P-value: 0.1228 (same as z-test!)
R Implementation
# Chi-square test in R
table <- matrix(c(500, 550, 9500, 9450), nrow = 2)
chisq.test(table, correct = FALSE)
When to Use Chi-Square Over Z-Test
Use chi-square when:
- You're comparing 3 or more variants simultaneously
- You want a single test for whether any group differs from the others
- Your organization standardizes on chi-square for historical reasons
For two groups, z-test and chi-square are interchangeable.
Fisher's Exact Test: For Small Samples
When sample sizes are small, the normal approximation breaks down. Fisher's exact test calculates the exact probability of observing your data (or more extreme) under the null hypothesis.
Why "Exact"?
The z-test and chi-square use approximations. Fisher's test enumerates all possible tables with the same row and column totals and calculates exact probabilities using the hypergeometric distribution. No approximation needed.
Python Implementation
from scipy.stats import fisher_exact
import numpy as np

# Small sample example: 15/200 control vs 25/200 treatment
table = np.array([[15, 185],
                  [25, 175]])

odds_ratio, p_value = fisher_exact(table, alternative='two-sided')

print(f"Odds ratio: {odds_ratio:.4f}")
print(f"P-value: {p_value:.4f}")
R Implementation
# Fisher's exact test in R
table <- matrix(c(15, 25, 185, 175), nrow = 2)
fisher.test(table)
When to Use Fisher's Exact
Fisher's exact test is appropriate when:
- Small samples: Total sample size under ~1,000
- Sparse cells: Any cell in the table has fewer than 5 expected observations
- Extreme rates: Conversion rate is very low (< 1%) or very high (> 99%)
- You want certainty: In regulatory contexts where approximations are questioned
The Computational Tradeoff
Fisher's exact test computes exact probabilities, which is computationally expensive for large samples. With 10,000 users per group, calculation can be slow. The z-test gives the same answer instantly.
Decision Framework
Here's when to use each test:
| Situation | Recommended Test |
|---|---|
| Large sample (n > 1,000 per group), typical rates (1-50%) | Z-test |
| Two groups, any large sample | Z-test or Chi-square (identical results) |
| Three or more variants | Chi-square |
| Small sample (n < 1,000 per group) | Fisher's exact |
| Very low rate (< 1%) or sparse cells | Fisher's exact |
| Regulatory/high-stakes context | Fisher's exact |
A Practical Algorithm
if (minimum_cell_count < 5 or sample_per_group < 1000):
    use Fisher's exact test
elif (number_of_groups > 2):
    use Chi-square test
else:
    use Z-test (or Chi-square, they're equivalent)
Why It Often Doesn't Matter
For typical A/B tests—thousands of users, conversion rates between 1% and 50%—all three tests give nearly identical p-values:
from scipy.stats import chi2_contingency, fisher_exact
from statsmodels.stats.proportion import proportions_ztest
import numpy as np

# Large sample example
table = np.array([[500, 9500], [550, 9450]])

# Z-test
z_stat, p_z = proportions_ztest([500, 550], [10000, 10000])

# Chi-square
chi2, p_chi, _, _ = chi2_contingency(table, correction=False)

# Fisher's exact
_, p_fisher = fisher_exact(table)

print(f"Z-test p-value: {p_z:.6f}")
print(f"Chi-square p-value: {p_chi:.6f}")
print(f"Fisher's exact p-value: {p_fisher:.6f}")

# All three will be essentially identical: ~0.1228
The differences only emerge at the edges: tiny samples, extreme rates, or sparse cells.
Common Mistakes
Using Fisher's Exact for Large Samples
Fisher's exact test is conservative (slightly higher p-values) compared to z-test for large samples. More importantly, it's computationally wasteful. If you have 50,000 users per group, just use the z-test.
Applying Continuity Correction by Default
Some implementations (like prop.test in R) apply Yates' continuity correction by default. This makes the test more conservative, which may reduce power unnecessarily for large samples. Be explicit about whether you want the correction.
Confusing Chi-Square for Multiple Comparisons
Chi-square tells you whether any group differs from the others—it doesn't tell you which groups differ. If you reject the null with 3+ groups, you need post-hoc tests (like pairwise comparisons with correction) to identify which specific groups differ.
Ignoring Effect Size
All three tests give p-values, but p-values don't measure effect size. Always report the actual conversion rates and confidence intervals alongside your p-value.
Confidence Intervals: The Better Output
Rather than obsessing over which test to use, focus on confidence intervals for the difference in proportions. A 95% CI gives more information than a binary significant/not significant decision.
from statsmodels.stats.proportion import confint_proportions_2indep

# 95% CI for the difference in proportions
ci_low, ci_upp = confint_proportions_2indep(
    count1=500, nobs1=10000,
    count2=550, nobs2=10000,
    method='wald'
)

print(f"95% CI for difference: [{ci_low:.4f}, {ci_upp:.4f}]")
# Output: [-0.0113, 0.0013]
# CI includes 0, consistent with p > 0.05
A confidence interval of [-0.3%, +1.3%] tells you far more than "."
Related Methods
- A/B Testing Statistical Methods for Product Teams — The pillar guide covering all A/B testing methods
- MDE and Sample Size: A Practical Guide — How to calculate the sample you need
- Non-Normal Metrics: Bootstrap, Mann-Whitney, and Log Transforms — When your metric isn't binary
Frequently Asked Questions
Q: I've seen prop.test in R give different results than statsmodels in Python. Why?
A: R's prop.test applies Yates' continuity correction by default. Use correct = FALSE to match Python's default behavior.
Q: Should I use one-tailed or two-tailed tests? A: Use two-tailed. In product experimentation, you should care if a change makes things worse, not just whether it makes things better.
Q: My sample sizes are unequal. Does that matter? A: No. All three tests handle unequal sample sizes correctly in their variance calculations.
Q: What about Barnard's exact test? A: Barnard's test is an exact test that's often more powerful than Fisher's. It's less commonly used because it's computationally intensive and results are very similar to Fisher's for most practical cases.
Key Takeaway
For most conversion rate experiments with reasonable sample sizes, use the two-proportion z-test. Reserve Fisher's exact test for small samples or extreme rates. Use chi-square when comparing more than two variants simultaneously. In practice, the choice rarely affects conclusions—what matters more is proper experiment design and honest interpretation.
References
- https://www.itl.nist.gov/div898/handbook/prc/section3/prc33.htm
- https://www.jstor.org/stable/2340521
- Newcombe, R. G. (1998). Two-sided confidence intervals for the single proportion: comparison of seven methods. *Statistics in Medicine*, 17(8), 857-872.
- Fisher, R. A. (1922). On the interpretation of χ² from contingency tables, and the calculation of P. *Journal of the Royal Statistical Society*, 85(1), 87-94.
- Agresti, A. (2002). *Categorical Data Analysis* (2nd ed.). Wiley-Interscience.
Frequently Asked Questions
When should I use Fisher's exact test?
Is chi-square better than z-test?
What if I have unequal sample sizes between groups?
Key Takeaway
For most conversion rate experiments with reasonable sample sizes, use the two-proportion z-test. Reserve Fisher's exact test for small samples or extreme rates. Use chi-square when comparing more than two variants simultaneously.