Contents
Reporting Templates: Stakeholder Language Without Overclaiming
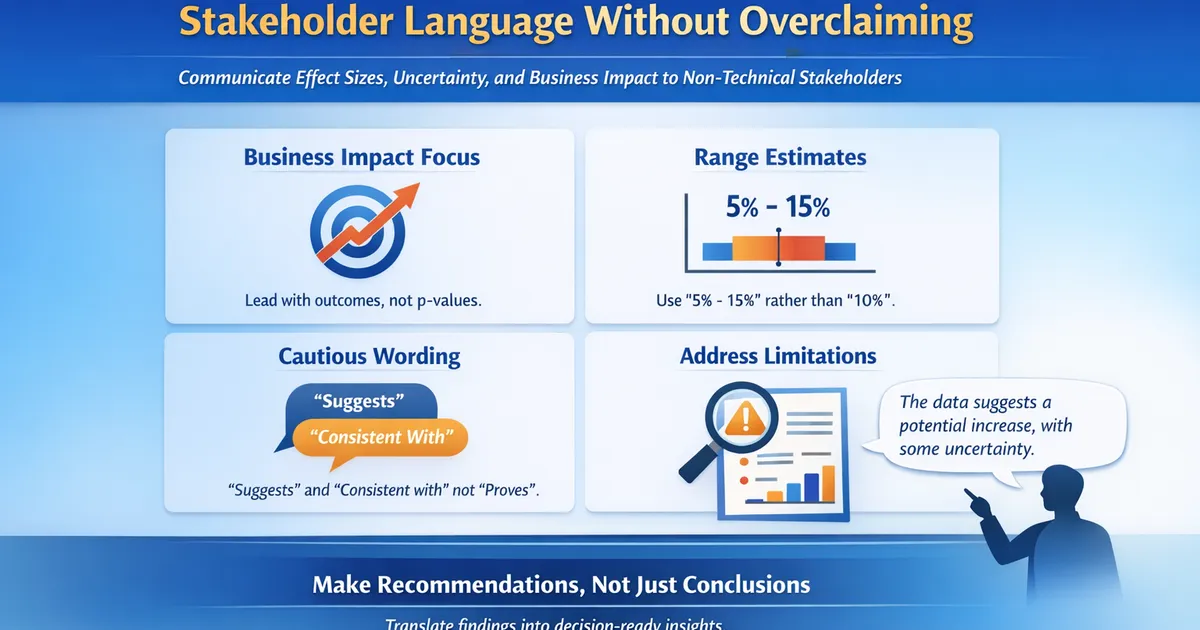
Ready-to-use templates for presenting statistical results to non-technical stakeholders. Learn to communicate effect sizes, uncertainty, and practical significance without oversimplifying or overclaiming.
Quick Hits
- •Lead with business impact, not p-values - stakeholders care about outcomes
- •Always pair point estimates with ranges - '5-15% lift' beats '10% lift'
- •Use 'consistent with' and 'suggests' rather than 'proves' or 'confirms'
- •Acknowledge limitations upfront - it builds credibility, not doubt
- •Provide decision recommendations, not just statistical conclusions
TL;DR
Effective statistical reporting translates technical findings into business language without losing accuracy. Lead with effect sizes and business impact, always include uncertainty ranges, use calibrated language that avoids overclaiming, and provide clear decision recommendations. This article provides copy-paste templates for common reporting scenarios, from experiment readouts to observational analyses.
The Communication Gap
Most statistical miscommunication falls into two failure modes:
Overclaiming: "The experiment proves that the new design increases conversion" (ignoring uncertainty, overstating causal claims)
Underclaiming: "Results were statistically significant at with a 95% CI of [0.012, 0.048]" (technically accurate, decision-irrelevant)
Good reporting threads the needle—conveying genuine findings with appropriate uncertainty in language stakeholders can act on.
Core Principles for Statistical Reporting
1. Lead with the Business Question
Start with what stakeholders asked, not what you measured:
Weak: "We conducted a two-sample t-test comparing conversion rates..."
Strong: "You asked whether the new checkout flow increases purchases. Here's what we found..."
2. Effect Sizes Before Significance
Weak: "Results were statistically significant ()"
Strong: "The new design increased conversion by 2.3 percentage points (from 4.1% to 6.4%)"
3. Always Include Uncertainty
Weak: "Conversion increased by 2.3 percentage points"
Strong: "Conversion increased by 2.3 percentage points (plausible range: 0.8 to 3.8 pp)"
4. Calibrate Your Language
| Confidence Level | Language |
|---|---|
| Very High | "We're confident that...", "The data strongly suggest..." |
| High | "Evidence indicates...", "Results are consistent with..." |
| Moderate | "The data suggest...", "There are indications that..." |
| Low | "There may be...", "We cannot rule out..." |
| Null | "We found no evidence that...", "The effect, if any, is smaller than..." |
5. Distinguish Correlation from Causation
Observational data: "Users who [behavior] tend to [outcome]" or "Associated with"
Experimental data: "Caused", "Led to", "Resulted in" (only for randomized experiments)
Template 1: Experiment Readout (Positive Result)
## [Experiment Name] Results

### Bottom Line
[New variant] increased [primary metric] by [X]% (plausible range: [Y]% to [Z]%).
This translates to approximately [business impact] per [time period].

### Recommendation
[Ship / Don't ship / Extend experiment] because [reason tied to practical significance].

### Key Findings

**Primary Metric: [Metric Name]**
- Control: [value]
- Treatment: [value]
- Difference: [absolute] ([relative]%)
- Plausible range: [lower] to [upper]
- Practical significance: [Above / Below / At] our [X]% threshold

**Secondary Metrics:**
| Metric | Change | Range | Assessment |
|--------|--------|-------|------------|
| [Metric 1] | +X% | [Y to Z]% | [No concerns / Monitor] |
| [Metric 2] | -X% | [Y to Z]% | [Acceptable / Investigate] |

**Guardrail Metrics:** All within acceptable bounds [or specify concerns]

### Confidence and Limitations
- Sample size: [N] users over [duration]
- We can rule out effects smaller than [MDE] with this sample
- [Any limitations: segment-specific, seasonal considerations, etc.]

### Next Steps
1. [Action item]
2. [Action item]
Example filled in:
## Simplified Checkout Results

### Bottom Line
The simplified checkout increased completed purchases by 12% (plausible range: 5% to 19%).
This translates to approximately $340K additional revenue per quarter.

### Recommendation
Ship to all users. The lower bound of our estimate (5%) exceeds our 3% practical
significance threshold, and no guardrail metrics showed concerning movement.

### Key Findings

**Primary Metric: Purchase Completion Rate**
- Control: 3.2%
- Treatment: 3.6%
- Difference: +0.4 percentage points (+12% relative)
- Plausible range: +0.16 to +0.61 pp (+5% to +19%)
- Practical significance: Above our 3% threshold even at lower bound

**Secondary Metrics:**
| Metric | Change | Range | Assessment |
|--------|--------|-------|------------|
| Cart additions | +3% | [-1% to 7%] | No concerns |
| Time to purchase | -8% | [-15% to -1%] | Positive signal |
| Support tickets | -2% | [-12% to 8%] | No concerns |

**Guardrail Metrics:** Revenue per user, return rate, and page errors all within bounds

### Confidence and Limitations
- Sample size: 284,000 users over 3 weeks
- Mobile users showed stronger effects (+18%) than desktop (+7%)
- Test ran during typical shopping period (no holidays)

### Next Steps
1. Engineering to prepare full rollout by [date]
2. Monitor mobile vs desktop performance post-launch
3. Consider further mobile-specific optimizations
Template 2: Experiment Readout (Null Result)
## [Experiment Name] Results

### Bottom Line
We found no meaningful difference in [primary metric] between [variants].
The true effect, if any, is likely smaller than [X]%.

### What This Means
With [N] users, we would have detected effects of [MDE] or larger with [power]%
probability. Since we didn't, we can confidently rule out effects above this threshold.

### Recommendation
[Do not ship / Return to design / Redirect resources] because [reason].

### Key Findings

**Primary Metric: [Metric Name]**
- Control: [value]
- Treatment: [value]
- Difference: [value] (plausible range: [lower] to [upper])
- This range includes zero and remains below our practical threshold of [X]%

### Why This Is Valuable
- Rules out: Effects larger than [upper bound]
- Saves: [resources that would have been spent on implementation]
- Informs: [future decisions this enables]

### Possible Interpretations
1. The change genuinely has no/minimal effect on this metric
2. [Alternative interpretation if relevant]
3. [Alternative interpretation if relevant]

### Next Steps
1. [Action item]
2. [Action item]
Template 3: Experiment Readout (Mixed/Inconclusive)
## [Experiment Name] Results

### Bottom Line
Results are inconclusive. The observed effect of [X]% could plausibly range from
[negative Y]% to [positive Z]%, which spans both meaningful positive and negative impacts.

### Why Inconclusive (Not "Failed")
Our uncertainty range is too wide to make a confident decision. This happens when:
- Sample size was insufficient for the effect size we're seeing
- Variance was higher than anticipated
- The true effect is close to our detection threshold

### Options

**Option A: Extend the experiment**
- Additional [N] users / [duration] would narrow uncertainty to [estimated range]
- Tradeoff: [delay / opportunity cost]

**Option B: Make a decision with current uncertainty**
- If we ship: [X]% chance of negative outcome up to [Y]%
- If we don't ship: [X]% chance of missing positive outcome up to [Z]%

**Option C: Redesign and retest**
- [Rationale for different approach]

### Recommendation
[Option with reasoning]

### Current Data

**Primary Metric: [Metric Name]**
- Observed difference: [X]%
- Plausible range: [Y]% to [Z]%
- Would need [N more users] to achieve [target precision]
Template 4: Observational Analysis
## [Analysis Name]

### Key Finding
[Users who X] have [Y]% [higher/lower] [metric] compared to [users who don't X].
This association [does/does not] hold after accounting for [confounders].

### Important Caveat
This is observational data. We cannot conclude that [X causes Y].
Possible explanations include:
1. [X] actually causes [Y]
2. [Y] causes [X] (reverse causation)
3. [Confounder Z] causes both
4. [Other explanation]

### What the Data Shows

**Comparison:**
| Group | [Metric] | Sample Size |
|-------|----------|-------------|
| [Group A] | [value] | [N] |
| [Group B] | [value] | [N] |

**Difference:** [X] ([range])

**After controlling for [confounders]:**
- Adjusted difference: [X] ([range])
- [Interpretation of how adjustment changed estimate]

### Recommended Interpretation
[How stakeholders should think about this finding]

### If You Want Causal Evidence
To establish whether [X] actually causes [Y], we would need to:
- [Option 1: experiment design]
- [Option 2: quasi-experimental approach]
Template 5: Metric Deep Dive
## [Metric Name] Analysis

### Summary
[Metric] has [increased/decreased/remained stable] by [X]% over [time period].
The primary driver appears to be [factor], which accounts for approximately [Y]%
of the change.

### Trend Overview
- Current value: [X]
- [Time period] ago: [Y]
- Change: [absolute] ([relative]%)
- Historical range: [min] to [max]

### Decomposition
| Factor | Contribution | Confidence |
|--------|--------------|------------|
| [Factor 1] | [X]% | [High/Medium/Low] |
| [Factor 2] | [X]% | [High/Medium/Low] |
| Unexplained | [X]% | — |

### Key Segments
[Segment with notable differences and their practical implications]

### Limitations
- [Data quality issues]
- [Confounds or alternative explanations]
- [Segments not analyzed]

### Recommended Actions
1. [Action item]
2. [Action item]
Language Patterns to Use and Avoid
Describing Results
| Avoid | Use Instead |
|---|---|
| "Proves that..." | "Provides evidence that..." |
| "Confirms our hypothesis" | "Is consistent with..." |
| "Definitely causes" | "Appears to lead to..." |
| "Failed to find significance" | "Found no evidence of meaningful effect" |
| "Just missed significance" | "The estimated effect was [X] with range [Y to Z]" |
Describing Uncertainty
| Avoid | Use Instead |
|---|---|
| "Error bars" | "Plausible range" or "uncertainty range" |
| "Confidence interval" (alone) | "We're [X]% confident the true value is between..." |
| "Statistically significant" | "Reliably different from zero" or effect size + range |
| "Not significant" | "Could not distinguish from zero" or "effect smaller than [X]" |
Describing Limitations
| Avoid | Use Instead |
|---|---|
| "The data is flawed" | "This analysis has the following constraints..." |
| "We can't trust this" | "These results should be interpreted with caution because..." |
| "It's just correlation" | "This shows association, not necessarily causation" |
Common Overclaiming Patterns
Pattern 1: P-value as Certainty
Overclaim: "With , we're 99.9% sure the effect is real"
Reality: P-values don't measure probability the effect is real. They measure probability of data given no effect.
Better: "The observed difference would be very unlikely if there were truly no effect"
Pattern 2: Point Estimate as Truth
Overclaim: "Revenue will increase by $2.3M"
Reality: $2.3M is our best guess; actual outcome could be anywhere in the confidence interval.
Better: "Revenue will likely increase by $1.5M to $3.1M, with $2.3M as our central estimate"
Pattern 3: Statistical as Practical
Overclaim: "The effect is significant, so we should ship"
Reality: Statistical significance just means "probably not zero"—it says nothing about business value.
Better: "The effect is reliably different from zero. Here's whether it's large enough to matter..."
Pattern 4: Single Metric Focus
Overclaim: "Conversion increased, so the experiment succeeded"
Reality: Need to consider guardrails, secondary metrics, and tradeoffs.
Better: "Conversion increased by [X]%. Before recommending launch, here's how other metrics moved..."
Pattern 5: Causal Claims from Observational Data
Overclaim: "Users who complete onboarding have 3x higher retention, so improving onboarding will 3x retention"
Reality: Observational correlation causal effect. Selection effects likely dominate.
Better: "Onboarding completion is associated with higher retention. An experiment would tell us whether improving onboarding causes better retention."
Calibrating Your Confidence
Use this framework to match language strength to evidence quality:
Strong Claims Require:
- Randomized experiment
- Large sample size
- Pre-registered primary metric
- Effect size well above practical threshold
- No concerning guardrail movements
- Robust to reasonable analysis choices
Example language: "We're confident that [X] increases [Y] by [amount]"
Moderate Claims Work With:
- Observational data with good controls
- Smaller experiments with clear effects
- Effect size near practical threshold
- Some sensitivity to analysis choices
Example language: "Evidence suggests [X] is associated with / may increase [Y]"
Weak Claims Are Appropriate For:
- Exploratory analysis
- Small samples
- Multiple comparisons without correction
- Results sensitive to analysis choices
- Observational data with likely confounds
Example language: "There are preliminary indications that [X] may relate to [Y], though further investigation is needed"
Code: Generating Report Text
Python
def format_experiment_result(
    metric_name: str,
    control_value: float,
    treatment_value: float,
    ci_lower: float,
    ci_upper: float,
    practical_threshold: float,
    is_percentage: bool = True
) -> str:
    """Generate stakeholder-friendly experiment result text."""

    diff = treatment_value - control_value
    relative_change = (diff / control_value) * 100 if control_value != 0 else 0

    # Format values
    if is_percentage:
        fmt = lambda x: f"{x:.1f}%"
        diff_fmt = f"{diff:.2f} percentage points"
    else:
        fmt = lambda x: f"{x:,.2f}"
        diff_fmt = f"{diff:,.2f}"

    # Determine result category
    if ci_lower > 0 and ci_lower > practical_threshold:
        assessment = "practically significant positive effect"
        recommendation = "The data support shipping this change."
    elif ci_upper < 0 and abs(ci_upper) > practical_threshold:
        assessment = "practically significant negative effect"
        recommendation = "The data suggest not shipping this change."
    elif ci_lower > 0:
        assessment = "statistically positive but below practical threshold"
        recommendation = "Effect is reliably positive but may be too small to matter."
    elif ci_upper < 0:
        assessment = "statistically negative but below practical threshold"
        recommendation = "Effect is reliably negative but may be too small to matter."
    else:
        assessment = "inconclusive"
        recommendation = "The data cannot distinguish a meaningful effect from zero."

    report = f"""
**{metric_name}**
- Control: {fmt(control_value)}
- Treatment: {fmt(treatment_value)}
- Difference: {diff_fmt} ({relative_change:+.1f}% relative)
- Plausible range: {ci_lower:+.2f} to {ci_upper:+.2f}
- Assessment: {assessment}

{recommendation}
"""
    return report.strip()


# Example usage
result = format_experiment_result(
    metric_name="Purchase Completion Rate",
    control_value=3.2,
    treatment_value=3.6,
    ci_lower=0.16,
    ci_upper=0.61,
    practical_threshold=0.10,  # 0.1 percentage points
    is_percentage=True
)
print(result)
R
format_experiment_result <- function(
    metric_name,
    control_value,
    treatment_value,
    ci_lower,
    ci_upper,
    practical_threshold,
    is_percentage = TRUE
) {
    #' Generate stakeholder-friendly experiment result text

    diff <- treatment_value - control_value
    relative_change <- (diff / control_value) * 100

    # Determine assessment
    if (ci_lower > 0 && ci_lower > practical_threshold) {
        assessment <- "practically significant positive effect"
        recommendation <- "The data support shipping this change."
    } else if (ci_upper < 0 && abs(ci_upper) > practical_threshold) {
        assessment <- "practically significant negative effect"
        recommendation <- "The data suggest not shipping this change."
    } else if (ci_lower > 0) {
        assessment <- "statistically positive but below practical threshold"
        recommendation <- "Effect is reliably positive but may be too small to matter."
    } else if (ci_upper < 0) {
        assessment <- "statistically negative but below practical threshold"
        recommendation <- "Effect is reliably negative but may be too small to matter."
    } else {
        assessment <- "inconclusive"
        recommendation <- "The data cannot distinguish a meaningful effect from zero."
    }

    # Format output
    if (is_percentage) {
        value_fmt <- function(x) sprintf("%.1f%%", x)
        diff_fmt <- sprintf("%.2f percentage points", diff)
    } else {
        value_fmt <- function(x) format(x, big.mark = ",", nsmall = 2)
        diff_fmt <- format(diff, big.mark = ",", nsmall = 2)
    }

    report <- sprintf("
**%s**
- Control: %s
- Treatment: %s
- Difference: %s (%+.1f%% relative)
- Plausible range: %+.2f to %+.2f
- Assessment: %s

%s
",
        metric_name,
        value_fmt(control_value),
        value_fmt(treatment_value),
        diff_fmt,
        relative_change,
        ci_lower,
        ci_upper,
        assessment,
        recommendation
    )

    cat(trimws(report))
}

# Example usage
format_experiment_result(
    metric_name = "Purchase Completion Rate",
    control_value = 3.2,
    treatment_value = 3.6,
    ci_lower = 0.16,
    ci_upper = 0.61,
    practical_threshold = 0.10,
    is_percentage = TRUE
)
Handling Pushback
"Just tell me if it worked or not"
Response: "The effect was [X]%. Whether that 'works' depends on your threshold for meaningful. If [business condition], then yes. If [other condition], then probably not. My recommendation is [action] because [reasoning]."
"Why are you hedging? Are you confident or not?"
Response: "I'm confident about what the data shows—the effect is likely between [X] and [Y]. What I can't do is hide that uncertainty, because it affects the risk of the decision. Given that range, here's what I recommend..."
"Can you remove all the caveats for the exec presentation?"
Response: "I can simplify the language, but I can't remove uncertainty that's real. Here's a cleaner version that still conveys the key limitations: [simplified version]"
"The CI crosses zero—so it's not significant?"
Response: "The CI crossing zero means we can't rule out zero effect, but it also doesn't mean the effect IS zero. The practical question is whether [lower bound] to [upper bound] represents a range of outcomes you're comfortable acting on."
Related Methods
- Effect Sizes, Confidence Intervals, and Practical Significance (Pillar) - Full framework
- Practical Significance Thresholds - Setting meaningful thresholds
- When CIs and P-Values Disagree - Resolving apparent conflicts
- P-Value vs. Confidence Interval - Understanding both metrics
Key Takeaway
Good statistical reporting isn't about dumbing down or hedging—it's about translating technical findings into decision-relevant language. Lead with business impact, always include uncertainty ranges, use calibrated language appropriate to your evidence strength, and provide clear recommendations. Your stakeholders don't need to understand p-values to make informed decisions; they need accurate information about what you learned, how confident you are, and what you recommend.
References
- https://www.nature.com/articles/d41586-019-00857-9
- https://amstat.tandfonline.com/doi/full/10.1080/00031305.2019.1583913
- https://journals.sagepub.com/doi/10.1177/2515245919847202
- Wasserstein, R. L., Schirm, A. L., & Lazar, N. A. (2019). Moving to a world beyond "p < 0.05." *The American Statistician*, 73(sup1), 1-19.
- Amrhein, V., Greenland, S., & McShane, B. (2019). Scientists rise up against statistical significance. *Nature*, 567, 305-307.
- McShane, B. B., Gal, D., Gelman, A., Robert, C., & Tackett, J. L. (2019). Abandon statistical significance. *The American Statistician*, 73(sup1), 235-245.
Frequently Asked Questions
Should I include p-values in executive summaries?
How do I report a null result without sounding like we wasted time?
What if stakeholders push back on uncertainty language?
Key Takeaway
Good statistical reporting translates technical findings into decision-relevant language that conveys both the finding and its uncertainty honestly, enabling stakeholders to make informed decisions without requiring statistical expertise.