Contents
Mann-Whitney U Test: What It Actually Tests and Common Misinterpretations
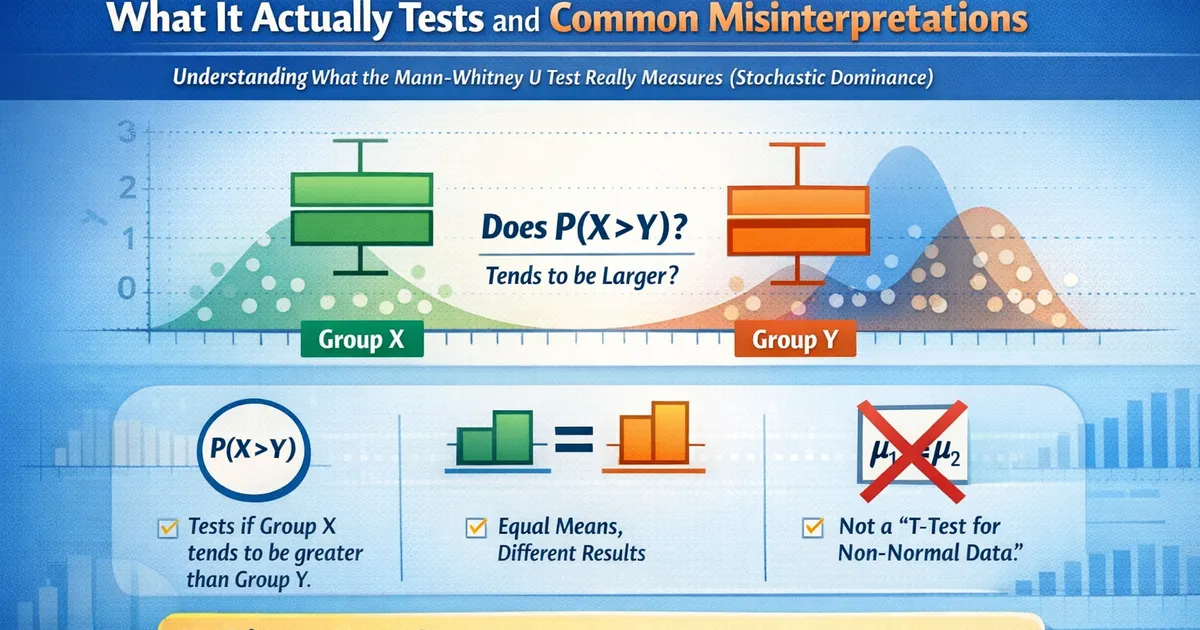
The Mann-Whitney U test is widely misunderstood. Learn what it actually tests (stochastic dominance), when it's appropriate, and why it's not always a substitute for the t-test.
Quick Hits
- •Mann-Whitney tests P(X > Y), not whether means differ
- •Two groups can have equal means but different Mann-Whitney results
- •It's not simply 't-test for non-normal data'—it answers a different question
- •Use it when 'tends to be larger' is your actual question, not as a default alternative
TL;DR
Mann-Whitney is not "the t-test for non-normal data." It tests whether one group stochastically dominates the other—roughly, whether randomly picking from group A tends to give larger values than randomly picking from group B. This is a different question than "do the means differ?" Understanding this distinction prevents misinterpretation and wrong test choice.
What Mann-Whitney Actually Tests
The Formal Hypothesis
For two independent groups with distributions F and G:
- H₀: P(X > Y) = P(Y > X) = 0.5 (where X ~ F, Y ~ G)
- :
In words: under the null, a randomly chosen observation from group 1 is equally likely to be larger or smaller than a randomly chosen observation from group 2.
The U Statistic
For every pair of observations (one from each group), count how many times the treatment observation exceeds the control:
Where if , if , and if .
import numpy as np
from scipy import stats

def calculate_u_manually(group1, group2):
    """Calculate U statistic by counting pairs."""
    u = 0
    for x in group1:
        for y in group2:
            if x > y:
                u += 1
            elif x == y:
                u += 0.5
    return u


# Example
group1 = np.array([1, 3, 5, 7, 9])
group2 = np.array([2, 4, 6, 8, 10])

u_manual = calculate_u_manually(group1, group2)
u_scipy, p = stats.mannwhitneyu(group1, group2)

print(f"U (manual): {u_manual}")
print(f"U (scipy): {u_scipy}")
print(f"P(group1 > group2): {u_manual / (len(group1) * len(group2)):.2f}")
When Mann-Whitney and T-Test Disagree
Same Means, Different Mann-Whitney
Two distributions can have identical means but different stochastic ordering:
import numpy as np
from scipy import stats

# Two distributions with same mean (5), different shapes
np.random.seed(42)

# Group 1: Concentrated around the mean
group1 = np.random.normal(5, 0.5, 1000)

# Group 2: More spread out, same mean
group2 = np.concatenate([
    np.random.uniform(0, 4, 500),   # Lower values
    np.random.uniform(6, 10, 500)   # Higher values
])

print(f"Group 1 mean: {np.mean(group1):.2f}")
print(f"Group 2 mean: {np.mean(group2):.2f}")

# T-test: no difference (same means)
t_stat, p_ttest = stats.ttest_ind(group1, group2)
print(f"\nT-test p-value: {p_ttest:.4f}")

# Mann-Whitney: significant difference!
u_stat, p_mw = stats.mannwhitneyu(group1, group2)
prob_g1_greater = u_stat / (len(group1) * len(group2))
print(f"Mann-Whitney p-value: {p_mw:.4f}")
print(f"P(group1 > group2): {prob_g1_greater:.2f}")
The groups have the same mean, but Mann-Whitney detects that group 1 values tend to fall in the middle while group 2 values are more extreme.
Different Means, Same Mann-Whitney
Symmetric differences around a point can yield no Mann-Whitney signal:
# Symmetric shift scenario
np.random.seed(123)

# Control: normal(0, 1)
control = np.random.normal(0, 1, 100)

# Treatment: same distribution, but some values much higher, some much lower
treatment = control + np.where(np.arange(100) % 2 == 0, 2, -2)

print(f"Control mean: {np.mean(control):.2f}")
print(f"Treatment mean: {np.mean(treatment):.2f}")

# Means differ!
t_stat, p_ttest = stats.ttest_ind(control, treatment)
print(f"\nT-test p-value: {p_ttest:.4f}")

# But Mann-Whitney sees no difference in stochastic dominance
u_stat, p_mw = stats.mannwhitneyu(control, treatment)
print(f"Mann-Whitney p-value: {p_mw:.4f}")
The Probability of Superiority
Mann-Whitney's effect size is interpretable as "probability of superiority"—the probability that a random treatment observation exceeds a random control observation.
def probability_of_superiority(group1, group2):
    """
    Calculate probability that group2 > group1.
    Also known as Common Language Effect Size.
    """
    u_stat, _ = stats.mannwhitneyu(group1, group2, alternative='two-sided')

    # scipy's U is for group1
    prob = u_stat / (len(group1) * len(group2))

    return prob


control = np.random.normal(0, 1, 100)
treatment = np.random.normal(0.5, 1, 100)

prob = probability_of_superiority(control, treatment)
print(f"P(treatment > control): {1 - prob:.2f}")
# With a Cohen's d of ~0.5, this is typically around 0.64
Interpreting Probability of Superiority
| P(treatment > control) | Interpretation |
|---|---|
| 0.50 | No difference—random chance |
| 0.56 | Small effect |
| 0.64 | Medium effect (roughly Cohen's d = 0.5) |
| 0.71 | Large effect (roughly Cohen's d = 0.8) |
| 0.80+ | Very large effect |
This is often more intuitive than Cohen's d: "If you pick a random treatment user and a random control user, treatment beats control 64% of the time."
When to Use Mann-Whitney
Good Uses
Ordinal data: Rankings, Likert scales, ratings where arithmetic means don't make sense.
Testing stochastic dominance: "Does treatment tend to produce higher values?" (not "is the mean higher?")
Robustness check: As a secondary analysis alongside t-test to check sensitivity.
Heavy tails with interest in ranks: When you care about typical ordering, not totals.
Bad Uses
As automatic t-test replacement: If you want to compare means, use t-test or bootstrap.
Because data is "non-normal": T-tests are robust to non-normality. Mann-Whitney answers a different question, not the same question with different assumptions.
For business metrics where totals matter: Revenue is about arithmetic mean users. Stochastic dominance doesn't translate to total revenue.
Comparison with T-Test
| Aspect | T-Test | Mann-Whitney |
|---|---|---|
| Tests | Mean difference | Stochastic dominance |
| Effect size | Mean difference, Cohen's d | P(A > B) |
| Assumes | Approximate normality (CLT) | Nothing about distribution shape |
| Sensitive to | Differences in means | Differences in distribution |
| Business translation | "Treatment users average $5 more" | "Treatment user tends to beat control 60% of the time" |
Python Implementation
from scipy import stats
import numpy as np

def mann_whitney_analysis(group1, group2, alternative='two-sided'):
    """
    Complete Mann-Whitney analysis with effect size.
    """
    # Mann-Whitney test
    u_stat, p_value = stats.mannwhitneyu(group1, group2, alternative=alternative)

    n1, n2 = len(group1), len(group2)

    # Probability of superiority (group1 > group2)
    prob_g1_greater = u_stat / (n1 * n2)

    # Rank-biserial correlation (another effect size)
    # r = 1 - (2U)/(n1*n2) or r = 2*prob - 1
    rank_biserial = 2 * prob_g1_greater - 1

    return {
        'u_statistic': u_stat,
        'p_value': p_value,
        'prob_g1_greater': prob_g1_greater,
        'prob_g2_greater': 1 - prob_g1_greater,
        'rank_biserial_r': rank_biserial,
        'n1': n1,
        'n2': n2
    }


# Example
np.random.seed(42)
control = np.random.exponential(10, 100)
treatment = np.random.exponential(12, 100)

result = mann_whitney_analysis(control, treatment)
print(f"U statistic: {result['u_statistic']}")
print(f"P-value: {result['p_value']:.4f}")
print(f"P(control > treatment): {result['prob_g1_greater']:.2f}")
print(f"P(treatment > control): {result['prob_g2_greater']:.2f}")
R Implementation
# Basic Mann-Whitney (Wilcoxon rank-sum)
wilcox.test(treatment, control)

# With confidence interval for location shift
wilcox.test(treatment, control, conf.int = TRUE)

# Note: The confidence interval is for the median difference
# under an assumption of equal shape (shift alternative)
Common Misinterpretations
"Mann-Whitney tests whether medians differ"
Only if you assume both groups have the same shape (just shifted). Without that assumption, it tests stochastic dominance, not medians.
"It's more powerful than t-test for skewed data"
Sometimes true, sometimes false. Mann-Whitney can be more powerful when data is heavily skewed and you care about ranks. But if you care about means, t-test (or bootstrap) is often better even with skew.
"Non-significant Mann-Whitney means groups are the same"
No—it means you can't reject equal stochastic ordering. Groups might differ in ways (like spread or shape) that Mann-Whitney doesn't detect.
"I should use Mann-Whitney because my data isn't normal"
The t-test doesn't require normal data—just approximately normal sampling distribution of the mean. With n > 30, CLT usually provides this. Mann-Whitney isn't "safe t-test"; it's a different test.
Related Methods
- Picking the Right Test to Compare Two Groups — Complete decision framework
- Non-Normal Metrics: Bootstrap, Mann-Whitney, and Log Transforms — Comprehensive guide to non-normal data
- Comparing Medians: Tests and Better Options — When you actually want to compare medians
Key Takeaway
The Mann-Whitney U test compares whether one group tends to have larger values than another—it doesn't test whether means differ. If you want to compare means on non-normal data, use a t-test (often robust) or bootstrap, not Mann-Whitney. Use Mann-Whitney when "tends to be larger" is actually your question, for ordinal data, or as a robustness check.
References
- https://www.jstor.org/stable/2332510
- https://www.ncbi.nlm.nih.gov/pmc/articles/PMC1120984/
- Mann, H. B., & Whitney, D. R. (1947). On a test of whether one of two random variables is stochastically larger than the other. *The Annals of Mathematical Statistics*, 18(1), 50-60.
- Fay, M. P., & Proschan, M. A. (2010). Wilcoxon-Mann-Whitney or t-test? On assumptions for hypothesis tests and multiple interpretations of decision rules. *Statistics Surveys*, 4, 1-39.
- Divine, G. W., Norton, H. J., Barón, A. E., & Juarez-Colunga, E. (2018). The Wilcoxon-Mann-Whitney procedure fails as a test of medians. *The American Statistician*, 72(3), 278-286.
Frequently Asked Questions
Is Mann-Whitney just a t-test that doesn't assume normality?
When should I use Mann-Whitney over a t-test?
What does the U statistic mean?
Key Takeaway
The Mann-Whitney U test compares whether one group tends to have larger values than another—it doesn't test whether means differ. If you want to compare means on non-normal data, use a t-test (often robust) or bootstrap, not Mann-Whitney.