Contents
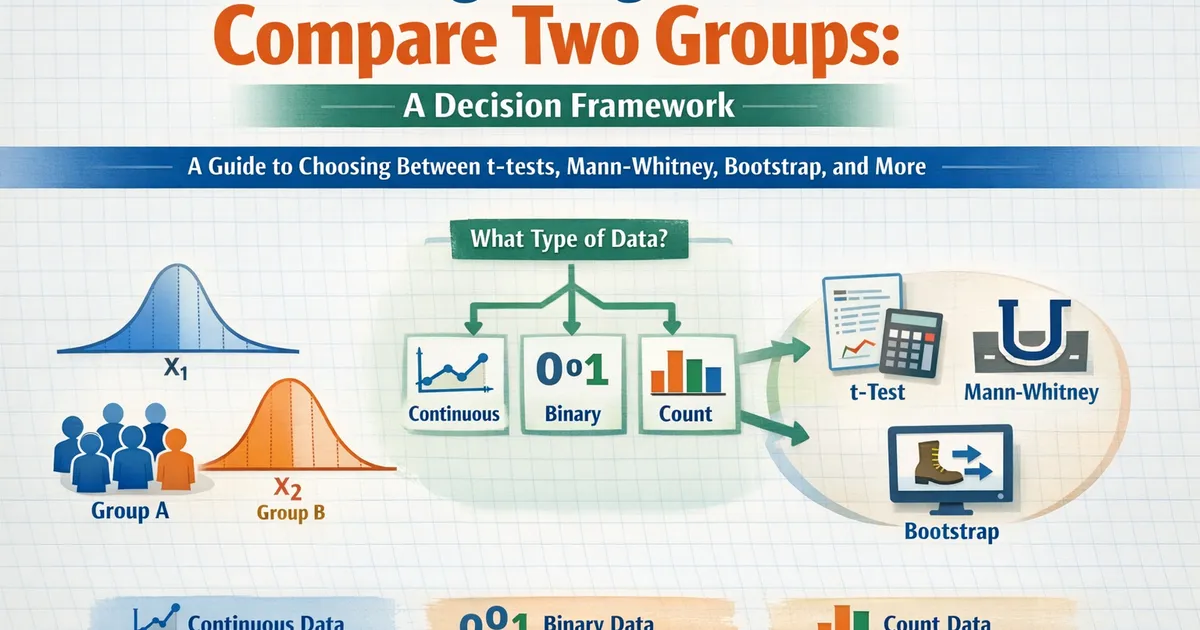
Picking the Right Test to Compare Two Groups: A Decision Framework
A comprehensive guide to choosing between t-tests, Mann-Whitney, bootstrap, and other methods when comparing two groups. Covers continuous, binary, and count data with practical decision trees.
Quick Hits
- •Welch's t-test is your default for continuous data—always use it over Student's t
- •Mann-Whitney tests 'tends to be larger' not 'has larger mean'—know the difference
- •Paired data requires paired tests—the wrong choice inflates variance dramatically
- •Bootstrap handles anything, but start simple and add complexity only when needed
TL;DR
Comparing two groups is the bread and butter of statistical analysis. Your default should be Welch's t-test for continuous data and two-proportion z-test for binary outcomes. Reach for alternatives when data is paired, heavily skewed, or when you need to test something other than means. This guide provides decision frameworks for every common scenario.
The Decision Framework
Before choosing a test, answer three questions:
- What type of data? Continuous, binary, count, ordinal?
- Are observations paired or independent? Same subjects, or different subjects?
- What are you testing? Means, medians, "tends to be larger," proportions?
What type of data?
├── Continuous (revenue, time, scores)
│   ├── Paired? → Paired t-test or Wilcoxon signed-rank
│   └── Independent? → Welch's t-test or Mann-Whitney
├── Binary (converted/didn't, clicked/didn't)
│   ├── Paired? → McNemar's test
│   └── Independent? → Z-test or Chi-square
├── Count (sessions, purchases, events)
│   └── Poisson or Negative Binomial methods
└── Ordinal (rankings, Likert scales)
    └── Mann-Whitney or ordinal regression
Continuous Data: The T-Test Family
Welch's T-Test: Your Default
For comparing means between two independent groups, Welch's t-test should be your default. It doesn't assume equal variances between groups—and variances are almost never equal.
from scipy import stats
import numpy as np

def welch_ttest(group1, group2, alternative='two-sided'):
    """
    Welch's t-test for comparing two group means.
    """
    stat, p_value = stats.ttest_ind(group1, group2, equal_var=False)

    # Effect size (Cohen's d with pooled SD)
    n1, n2 = len(group1), len(group2)
    pooled_std = np.sqrt(((n1-1)*np.var(group1, ddof=1) + (n2-1)*np.var(group2, ddof=1)) / (n1+n2-2))
    cohens_d = (np.mean(group2) - np.mean(group1)) / pooled_std

    # Confidence interval for difference
    diff = np.mean(group2) - np.mean(group1)
    se = np.sqrt(np.var(group1, ddof=1)/n1 + np.var(group2, ddof=1)/n2)
    df = (np.var(group1, ddof=1)/n1 + np.var(group2, ddof=1)/n2)**2 / \
         ((np.var(group1, ddof=1)/n1)**2/(n1-1) + (np.var(group2, ddof=1)/n2)**2/(n2-1))
    t_crit = stats.t.ppf(0.975, df)
    ci = (diff - t_crit * se, diff + t_crit * se)

    return {
        't_statistic': stat,
        'p_value': p_value,
        'mean_difference': diff,
        'ci_95': ci,
        'cohens_d': cohens_d
    }
R Implementation
# Welch's t-test (default in R)
t.test(group2, group1)

# With equal variance assumption (don't use this)
t.test(group2, group1, var.equal = TRUE)
Why Not Student's T-Test?
Student's t-test assumes equal variances. When variances differ:
- Type I error inflates when the larger variance is in the smaller group
- Type I error is conservative when the larger variance is in the larger group
Welch's t-test handles both cases correctly and performs essentially identically to Student's when variances are equal. There's no reason to use Student's anymore.
For more on this comparison, see Welch's vs. Student's T-Test.
Paired vs. Independent Data
The distinction between paired and independent data is crucial—using the wrong test can dramatically inflate your variance estimate.
When Data Is Paired
Data is paired when:
- Same subjects measured twice: Before/after, pre/post treatment
- Matched subjects: Each treatment subject matched to a similar control
- Natural pairs: Left/right eye, twins, matched geographic regions
The Paired T-Test
def paired_ttest(before, after):
    """
    Paired t-test using within-subject differences.
    """
    differences = np.array(after) - np.array(before)

    stat, p_value = stats.ttest_1samp(differences, 0)

    mean_diff = np.mean(differences)
    se = np.std(differences, ddof=1) / np.sqrt(len(differences))
    ci = (mean_diff - 1.96 * se, mean_diff + 1.96 * se)

    return {
        't_statistic': stat,
        'p_value': p_value,
        'mean_difference': mean_diff,
        'ci_95': ci
    }
Why Pairing Matters
Consider comparing a weight loss intervention:
Without pairing (independent samples t-test):
- Compares average weight in treatment vs. control
- Variance includes between-person differences (some people weigh 150 lbs, others 250 lbs)
With pairing (paired t-test):
- Compares weight change within each person
- Variance only includes variation in weight changes
- Often 5-10x more powerful
# Simulation showing power difference
np.random.seed(42)
n = 30

# People have different baseline weights (high between-person variance)
baseline_weights = np.random.normal(180, 40, n)

# Treatment causes 5 lb loss (small effect)
treatment_effect = -5
noise = np.random.normal(0, 3, n)

before = baseline_weights + np.random.normal(0, 3, n)
after = baseline_weights + treatment_effect + noise

# Independent test (wrong!) - treats them as different people
_, p_independent = stats.ttest_ind(before, after)

# Paired test (correct)
_, p_paired = stats.ttest_rel(before, after)

print(f"Independent t-test p-value: {p_independent:.4f}")
print(f"Paired t-test p-value: {p_paired:.4f}")
# Paired test will be much more significant
For diagnosing whether your data is paired, see Paired vs. Independent Data: A Diagnostic Checklist.
Non-Parametric Alternatives
When normality assumptions are questionable, non-parametric tests don't assume any particular distribution.
Mann-Whitney U Test
For independent samples, Mann-Whitney tests whether one group tends to have larger values (stochastic dominance).
def mann_whitney_analysis(group1, group2):
    """
    Mann-Whitney U test with effect size.
    """
    stat, p_value = stats.mannwhitneyu(group1, group2, alternative='two-sided')

    # Common language effect size (probability group2 > group1)
    n1, n2 = len(group1), len(group2)
    prob_superiority = stat / (n1 * n2)

    return {
        'u_statistic': stat,
        'p_value': p_value,
        'prob_group2_larger': prob_superiority
    }
Important: Mann-Whitney does NOT test whether means differ. Two groups can have identical means but different Mann-Whitney results (if their shapes differ). And two groups can have different means but identical Mann-Whitney results (if the differences are symmetric).
For the nuances, see Mann-Whitney U Test: What It Actually Tests.
Wilcoxon Signed-Rank Test
The paired equivalent of Mann-Whitney:
def wilcoxon_analysis(before, after):
    """
    Wilcoxon signed-rank test for paired data.
    """
    stat, p_value = stats.wilcoxon(before, after, alternative='two-sided')

    return {
        'statistic': stat,
        'p_value': p_value
    }
Binary Outcomes
For comparing proportions (conversion rates, click rates), use tests designed for binary data.
Two-Proportion Z-Test
from statsmodels.stats.proportion import proportions_ztest, confint_proportions_2indep

def compare_proportions(successes1, n1, successes2, n2):
    """
    Compare two proportions with confidence interval.
    """
    stat, p_value = proportions_ztest([successes1, successes2], [n1, n2])

    p1, p2 = successes1/n1, successes2/n2
    diff = p2 - p1

    # Confidence interval for difference
    ci_low, ci_high = confint_proportions_2indep(successes1, n1, successes2, n2)

    return {
        'p1': p1,
        'p2': p2,
        'difference': diff,
        'ci_95': (ci_low, ci_high),
        'p_value': p_value
    }
Chi-Square Test
Equivalent to z-test for two groups, but extends to multiple groups:
from scipy.stats import chi2_contingency

# Create contingency table
table = [[successes1, n1 - successes1],
         [successes2, n2 - successes2]]

chi2, p_value, dof, expected = chi2_contingency(table, correction=False)
Fisher's Exact Test
For small samples or extreme proportions:
from scipy.stats import fisher_exact

table = [[successes1, n1 - successes1],
         [successes2, n2 - successes2]]

odds_ratio, p_value = fisher_exact(table)
Bootstrap Methods
When standard tests don't fit or you want distribution-free inference, bootstrap handles anything.
Bootstrap for Mean Difference
def bootstrap_comparison(group1, group2, n_bootstrap=10000, alpha=0.05):
    """
    Bootstrap comparison of two groups.
    Works for any statistic, not just means.
    """
    observed_diff = np.mean(group2) - np.mean(group1)

    # Bootstrap distribution
    diffs = []
    for _ in range(n_bootstrap):
        boot1 = np.random.choice(group1, size=len(group1), replace=True)
        boot2 = np.random.choice(group2, size=len(group2), replace=True)
        diffs.append(np.mean(boot2) - np.mean(boot1))

    diffs = np.array(diffs)

    # Percentile CI
    ci_low = np.percentile(diffs, 100 * alpha / 2)
    ci_high = np.percentile(diffs, 100 * (1 - alpha / 2))

    # Bootstrap p-value (permutation approach)
    combined = np.concatenate([group1, group2])
    null_diffs = []
    for _ in range(n_bootstrap):
        np.random.shuffle(combined)
        perm1 = combined[:len(group1)]
        perm2 = combined[len(group1):]
        null_diffs.append(np.mean(perm2) - np.mean(perm1))

    null_diffs = np.array(null_diffs)
    p_value = np.mean(np.abs(null_diffs) >= np.abs(observed_diff))

    return {
        'difference': observed_diff,
        'ci_95': (ci_low, ci_high),
        'p_value': p_value
    }
When Bootstrap Excels
- Heavy-tailed data (revenue, latency)
- Complex statistics (medians, percentiles, ratios)
- Small samples where CLT may not apply
- When you want honest confidence intervals
For more on bootstrap with difficult data, see Bootstrap Confidence Intervals for Difference in Means.
Comparing Medians
Sometimes the median is more relevant than the mean—when outliers dominate or when "typical" is the business question.
Mood's Median Test
Tests whether groups have the same median:
from scipy.stats import median_test

stat, p_value, med, table = median_test(group1, group2)
Quantile Regression
More flexible approach that estimates conditional quantiles:
import statsmodels.formula.api as smf
import pandas as pd

# Create dataframe
df = pd.DataFrame({
    'value': np.concatenate([group1, group2]),
    'treatment': [0]*len(group1) + [1]*len(group2)
})

# Median regression
model = smf.quantreg('value ~ treatment', df)
result = model.fit(q=0.5)
print(result.summary())
For more options, see Comparing Medians: Tests and Better Options.
Comparing Variances
Sometimes you care about spread, not just center.
Levene's Test
Robust test for equality of variances:
from scipy.stats import levene

stat, p_value = levene(group1, group2)
Brown-Forsythe Test
Uses median instead of mean—even more robust:
stat, p_value = levene(group1, group2, center='median')
For details, see Comparing Variances: Levene, Bartlett, and F-Test.
Handling Outliers
Outliers can dominate mean comparisons. Options:
Trimmed Mean Test
Remove extreme values from both tails:
from scipy.stats import trim_mean
from scipy.stats.mstats import trimmed_std

def trimmed_ttest(group1, group2, proportiontocut=0.1):
    """
    T-test on trimmed means (10% from each tail by default).
    """
    tm1 = trim_mean(group1, proportiontocut)
    tm2 = trim_mean(group2, proportiontocut)

    # Yuen's test
    stat, p_value = stats.mstats.ttest_ind(group1, group2, trim=proportiontocut)

    return {
        'trimmed_mean1': tm1,
        'trimmed_mean2': tm2,
        'difference': tm2 - tm1,
        'p_value': p_value
    }
Winsorized Test
Cap extreme values at percentiles:
from scipy.stats.mstats import winsorize

group1_wins = winsorize(group1, limits=[0.05, 0.05])  # Cap at 5th and 95th percentile
group2_wins = winsorize(group2, limits=[0.05, 0.05])

stat, p_value = stats.ttest_ind(group1_wins, group2_wins)
For guidance, see Handling Outliers: Trimmed Means, Winsorization, and Robust Methods.
Quick Reference Table
| Situation | Recommended Test | Alternative |
|---|---|---|
| Two independent groups, continuous | Welch's t-test | Bootstrap, Mann-Whitney |
| Two paired groups, continuous | Paired t-test | Wilcoxon signed-rank |
| Two groups, binary outcome | Z-test / Chi-square | Fisher's exact (small n) |
| Two paired groups, binary | McNemar's test | — |
| Heavy-tailed data | Bootstrap | Trimmed mean, Winsorized |
| Ordinal data | Mann-Whitney | Ordinal regression |
| Testing medians | Bootstrap | Quantile regression |
| Testing variances | Levene's test | Brown-Forsythe |
Related Articles
Dive deeper into specific topics:
- Welch's T-Test vs. Student's T-Test
- Mann-Whitney U Test: What It Actually Tests
- Comparing Medians: Tests and Better Options
- Comparing Variances: Levene, Bartlett, and F-Test
- Paired vs. Independent Data: A Diagnostic Checklist
- Handling Outliers: Trimmed Means, Winsorization, and Robust Methods
- Comparing Rates and Events per User
- Bootstrap Confidence Intervals for Difference in Means
Frequently Asked Questions
Q: Should I test for normality before choosing a test? A: No. Formal normality tests are unreliable—they reject trivial deviations with large samples and miss serious violations with small samples. Look at histograms, check for outliers, and use domain knowledge.
Q: Is it wrong to use the t-test on non-normal data? A: Usually not. The t-test is robust to non-normality with reasonable sample sizes (n > 30). Extreme skew or outliers matter more than technical non-normality.
Q: What if my two groups have very different sizes? A: Welch's t-test handles unequal sizes naturally. Power will be limited by the smaller group. Consider whether the imbalance reflects reality or a sampling issue.
Q: Can I use multiple tests and pick the one that gives significance? A: No—that's p-hacking. Choose your test before seeing results based on your data type and question. If you run multiple tests as sensitivity analyses, report all of them.
Key Takeaway
Start with Welch's t-test for continuous data and two-proportion z-test for binary data. These handle most situations correctly. Reach for bootstrap when distributions are extreme, Mann-Whitney when testing stochastic dominance rather than means, and paired tests when data is naturally paired. The "perfect" test matters less than understanding what question you're actually answering and reporting effect sizes with confidence intervals.
References
- https://www.jstor.org/stable/2682923
- https://www.bmj.com/content/350/bmj.h2053
- Ruxton, G. D. (2006). The unequal variance t-test is an underused alternative to Student's t-test and the Mann-Whitney U test. *Behavioral Ecology*, 17(4), 688-690.
- Fay, M. P., & Proschan, M. A. (2010). Wilcoxon-Mann-Whitney or t-test? On assumptions for hypothesis tests and multiple interpretations of decision rules. *Statistics Surveys*, 4, 1-39.
- Efron, B., & Tibshirani, R. J. (1993). *An Introduction to the Bootstrap*. Chapman & Hall/CRC.
Frequently Asked Questions
Should I test for normality before choosing a test?
When is Mann-Whitney better than the t-test?
What's the difference between paired and independent tests?
Key Takeaway
Start with Welch's t-test for continuous data and two-proportion z-test for binary data. These handle most situations. Reach for bootstrap when distributions are extreme, Mann-Whitney when testing stochastic dominance, and paired tests when data is naturally paired. The 'perfect' test matters less than understanding what question you're actually answering.