Contents
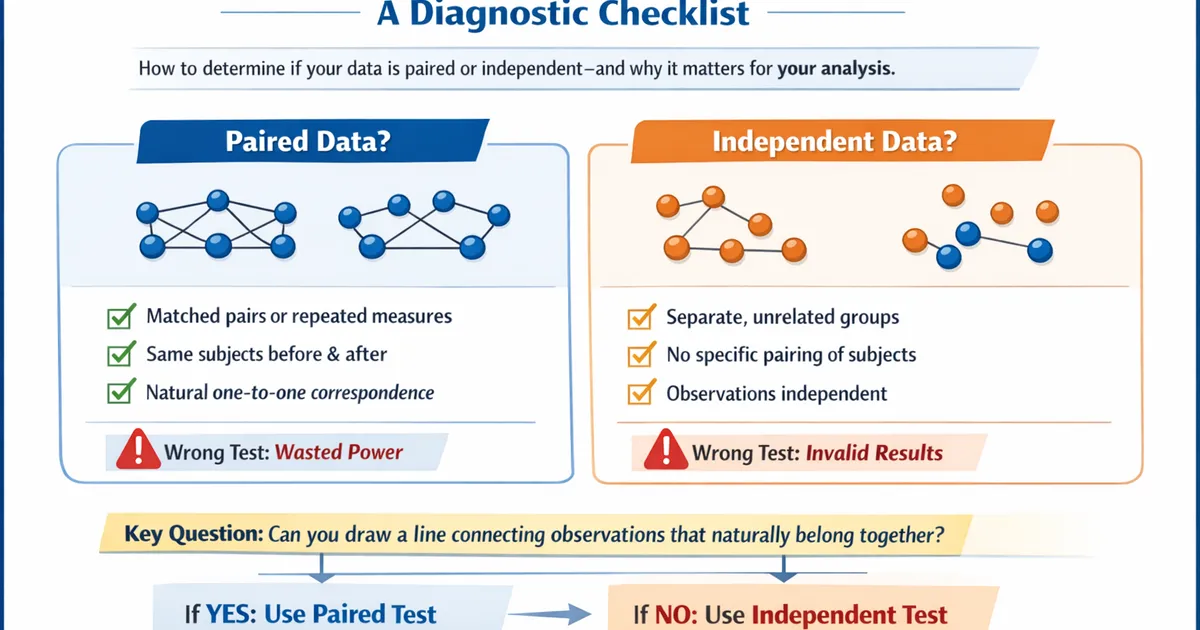
Paired vs. Independent Data: A Diagnostic Checklist
How to determine whether your data is paired or independent, and why getting this wrong can dramatically affect your statistical power and validity.
Quick Hits
- •Using independent tests on paired data wastes power—sometimes 5-10x less efficient
- •Using paired tests on independent data gives invalid inference
- •Key question: Can you draw a line connecting observations that naturally belong together?
- •When in doubt, paired analysis is more conservative (wider CIs) if pairing is weak
TL;DR
Paired and independent data require different statistical tests. The distinction is about whether observations have a natural one-to-one correspondence. Using the wrong test type either wastes statistical power (independent test on paired data) or gives invalid results (paired test on independent data). This guide helps you diagnose which you have.
The Fundamental Question
Can you draw a line connecting each observation in Group A to exactly one observation in Group B, where that connection represents something meaningful?
If yes → Paired data If no → Independent data
Examples of Paired Data
| Group A | Connection | Group B |
|---|---|---|
| Patient pre-treatment | Same patient | Patient post-treatment |
| Left eye | Same person | Right eye |
| Monday sales | Same store | Tuesday sales |
| Student's pre-test | Same student | Student's post-test |
| Treatment city A | Matched on size/demographics | Control city B |
Examples of Independent Data
| Group A | No natural pairing | Group B |
|---|---|---|
| Customers in treatment | Different people | Customers in control |
| Batch 1 | Different batches | Batch 2 |
| Company A | Different companies | Company B |
| 2023 users | Different time periods | 2024 users |
Diagnostic Checklist
Answer these questions about your data:
Question 1: Same Subjects Measured Twice?
If YES: Classic paired design
- Before/after treatment on the same individuals
- Pre-test/post-test designs
- Crossover trials (each subject gets both treatments)
# Example: Same patients measured before and after
before = [180, 165, 210, 155, 190]  # Blood pressure before
after = [175, 160, 195, 150, 180]   # Same patients after treatment

# Paired t-test
from scipy import stats
stat, p_value = stats.ttest_rel(before, after)
Question 2: Naturally Matched Pairs?
If YES: Matched-pairs design
- Twins randomized to different treatments
- Matched case-control studies
- Split-plot designs (left/right, two halves)
# Example: Twin pairs, one twin per treatment
twin_a = [72, 68, 85, 61, 77]  # Treatment A twin
twin_b = [75, 71, 82, 65, 79]  # Treatment B twin

# Paired t-test
stat, p_value = stats.ttest_rel(twin_a, twin_b)
Question 3: Repeated Measurements on Same Units?
If YES: Repeated measures
- Same stores measured in treatment vs. control periods
- Same machines tested under different conditions
- Time series on the same subjects
# Example: Same stores in two different weeks
week1 = [1000, 1200, 800, 1500, 950]
week2 = [1100, 1250, 850, 1600, 1000]

# Paired t-test
stat, p_value = stats.ttest_rel(week1, week2)
Question 4: Can Observations Be Interchanged?
If YES (any observation could logically be paired with any other) → Independent
If you randomly shuffled Group A observations and paired them with Group B observations, would the analysis be just as valid? If yes, your data is independent.
# Example: Different customers in A/B test
control_revenue = [45, 23, 67, 12, 89, 34]
treatment_revenue = [52, 31, 72, 15, 95]  # Different number even!

# Independent t-test (Welch's)
stat, p_value = stats.ttest_ind(control_revenue, treatment_revenue, equal_var=False)
Why It Matters: A Simulation
The wrong test can dramatically affect power:
import numpy as np
from scipy import stats

def compare_tests(n_pairs=30, effect=0.3, between_subject_sd=2, within_subject_sd=0.5,
                  n_simulations=10000):
    """
    Compare power of paired vs. independent tests when data is truly paired.
    """
    paired_significant = 0
    independent_significant = 0

    for _ in range(n_simulations):
        # Generate paired data with between-subject variation
        subject_means = np.random.normal(0, between_subject_sd, n_pairs)

        # Condition 1: baseline + noise
        condition1 = subject_means + np.random.normal(0, within_subject_sd, n_pairs)

        # Condition 2: baseline + effect + noise
        condition2 = subject_means + effect + np.random.normal(0, within_subject_sd, n_pairs)

        # Paired test (correct)
        _, p_paired = stats.ttest_rel(condition1, condition2)

        # Independent test (incorrect - ignores pairing)
        _, p_independent = stats.ttest_ind(condition1, condition2)

        if p_paired < 0.05:
            paired_significant += 1
        if p_independent < 0.05:
            independent_significant += 1

    return paired_significant / n_simulations, independent_significant / n_simulations


# High between-subject variance relative to effect
paired_power, independent_power = compare_tests(
    effect=0.3,
    between_subject_sd=2,
    within_subject_sd=0.5
)

print(f"Paired test power: {paired_power:.1%}")
print(f"Independent test power: {independent_power:.1%}")
# Paired might be 80%, independent might be 10%!
When between-subject variance is high relative to the effect, the independent test can have dramatically lower power because it treats subject-to-subject variation as noise.
The Mathematics
Independent Samples
Variance of the difference in means:
Paired Samples
Variance of the mean difference:
Where
When (positive correlation within pairs), , so paired analysis has lower variance.
The correlation captures how much observations within a pair resemble each other. Higher correlation → more power gain from pairing.
Common Mistakes
Mistake 1: Treating Repeated Users as Independent
In A/B tests, the same user might appear multiple times. Treating each session as independent inflates sample size and underestimates variance.
Solution: Aggregate to user-level, or use mixed models.
Mistake 2: Artificial Pairing
Don't create pairings that don't exist. Sorting both groups and pairing 1st with 1st, 2nd with 2nd, etc. is invalid if subjects aren't actually matched.
Mistake 3: Ignoring Natural Pairing
If the same subjects are in both groups, use that information! Ignoring pairing throws away power.
Mistake 4: Unequal Pair Members Dropping
In paired designs, if one member of a pair is missing, you typically must drop the entire pair. This can reduce sample size substantially.
Edge Cases
Clustered But Not Paired
Students in classrooms, users in regions. Observations within clusters are correlated but not paired. Use cluster-robust standard errors, not paired tests.
Pre-Post with Different Subjects
If you measured different people before and after an intervention (not the same people), that's independent data, not paired.
One-to-Many Relationships
One control matched to multiple treatments (or vice versa). This isn't simple pairing—consider mixed models or properly weighted analyses.
Decision Flowchart
Is each observation in Group A naturally connected
to exactly one observation in Group B?
│
├── YES: Is this connection meaningful for the comparison?
│   │
│   ├── YES → Use PAIRED test
│   │         (paired t-test, Wilcoxon signed-rank)
│   │
│   └── NO → Use INDEPENDENT test
│            (The pairing doesn't help isolate the effect)
│
└── NO → Use INDEPENDENT test
         (Welch's t-test, Mann-Whitney)
Implementation
Paired T-Test
from scipy import stats

# Data must be in matching order
before = [180, 165, 210, 155, 190]
after = [175, 160, 195, 150, 180]

stat, p_value = stats.ttest_rel(before, after)
mean_diff = np.mean(np.array(after) - np.array(before))
print(f"Mean difference: {mean_diff:.1f}")
print(f"P-value: {p_value:.4f}")
Independent T-Test
group1 = [45, 23, 67, 12, 89, 34]
group2 = [52, 31, 72, 15, 95, 48]

stat, p_value = stats.ttest_ind(group1, group2, equal_var=False)  # Welch's
print(f"P-value: {p_value:.4f}")
Non-Parametric Equivalents
# Paired: Wilcoxon signed-rank
stat, p_value = stats.wilcoxon(before, after)

# Independent: Mann-Whitney U
stat, p_value = stats.mannwhitneyu(group1, group2)
Related Methods
- Picking the Right Test to Compare Two Groups — Complete decision framework
- Independence: The Silent Killer — When independence fails
- Clustered Experiments — Correlation without pairing
Key Takeaway
The paired vs. independent distinction is about study design, not statistics. Ask: "Is there a natural one-to-one correspondence between observations in the two groups?" If yes, use paired tests to capture the within-unit comparison. If no, use independent tests. Getting this right can be the difference between detecting an effect and missing it entirely—paired analysis can be 5-10x more powerful when between-subject variance is high.
References
- https://www.jstor.org/stable/2683903
- https://www.ncbi.nlm.nih.gov/pmc/articles/PMC3116956/
- Bland, J. M., & Altman, D. G. (1994). Statistics notes: matching. *BMJ*, 309(6962), 1128.
- Senn, S. (2002). *Cross-over Trials in Clinical Research* (2nd ed.). Wiley.
- Zimmerman, D. W. (1997). A note on interpretation of the paired-samples t test. *Journal of Educational and Behavioral Statistics*, 22(3), 349-360.
Frequently Asked Questions
What makes data paired vs independent?
What happens if I use the wrong test?
Can paired and independent analyses give opposite conclusions?
Key Takeaway
The paired vs. independent distinction is about study design, not statistics. Ask: 'Is there a natural one-to-one correspondence between observations in the two groups?' If yes, use paired tests. If no, use independent tests. Getting this right can be the difference between detecting an effect and missing it entirely.