StatsTest Blog
Experimental design, data analysis, and statistical tooling for modern teams. No hype, just the math.
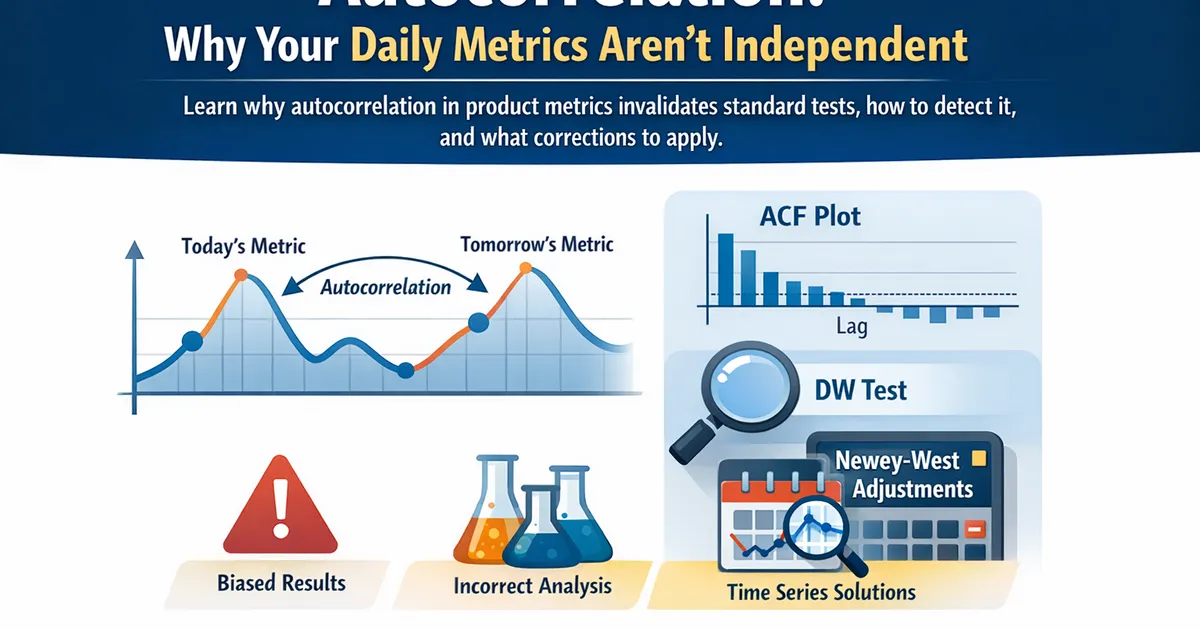
Autocorrelation: Why Your Daily Metrics Aren't Independent
Learn why autocorrelation in product metrics invalidates standard tests, how to detect it, and what corrections to apply.
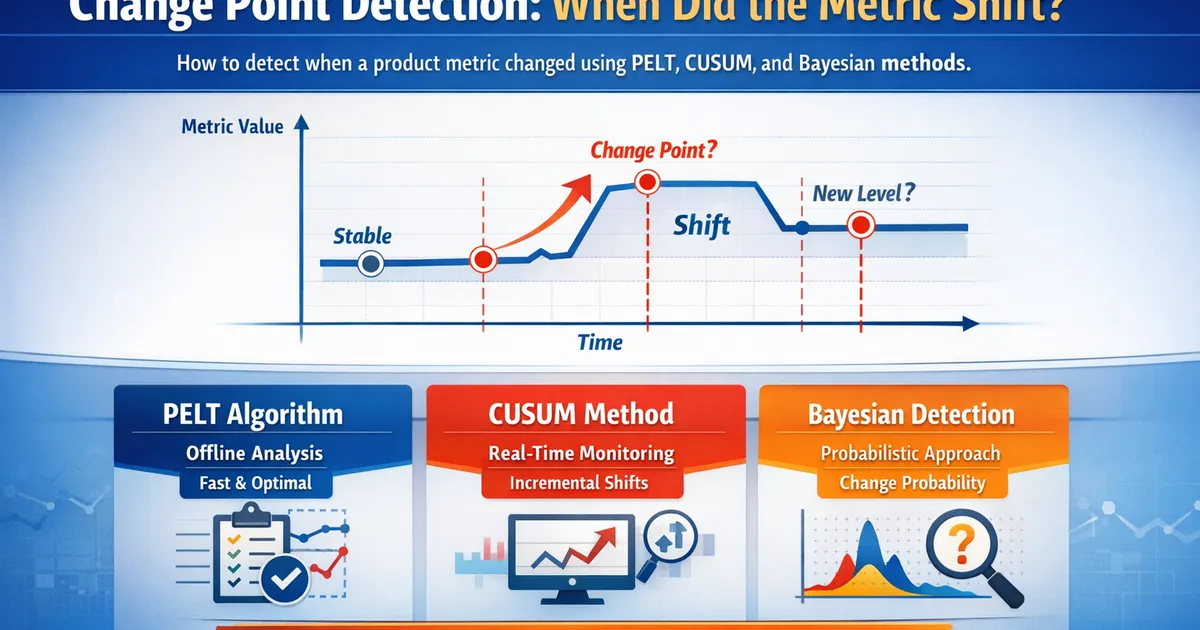
Change Point Detection: When Did the Metric Shift?
How to detect when a product metric changed using PELT, CUSUM, and Bayesian change point detection methods.
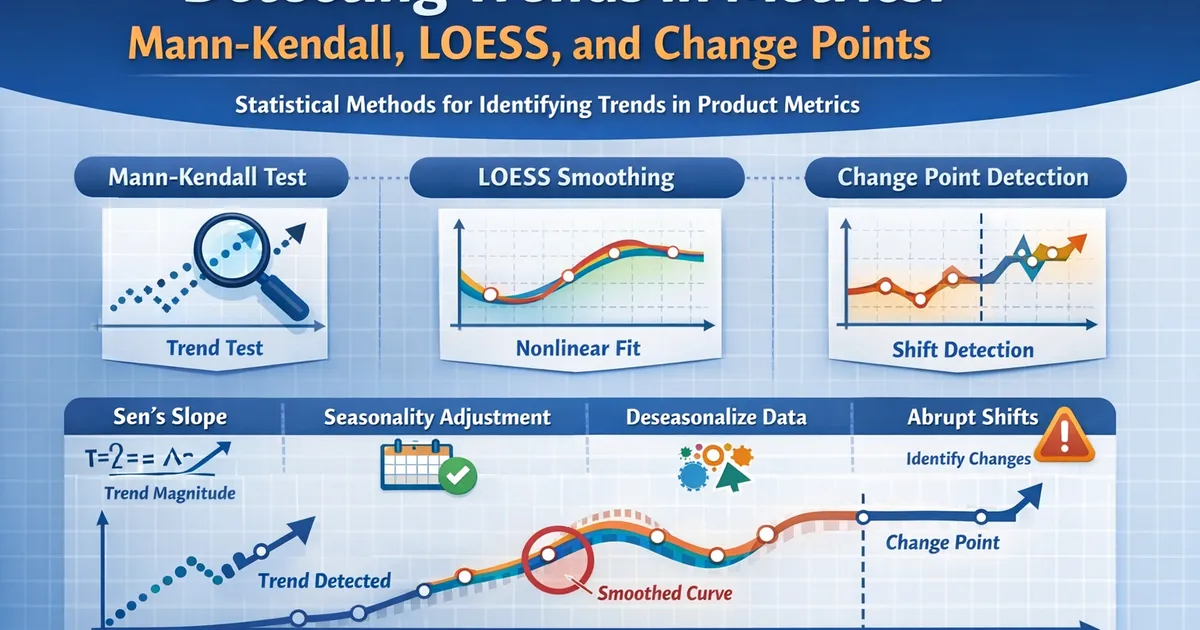
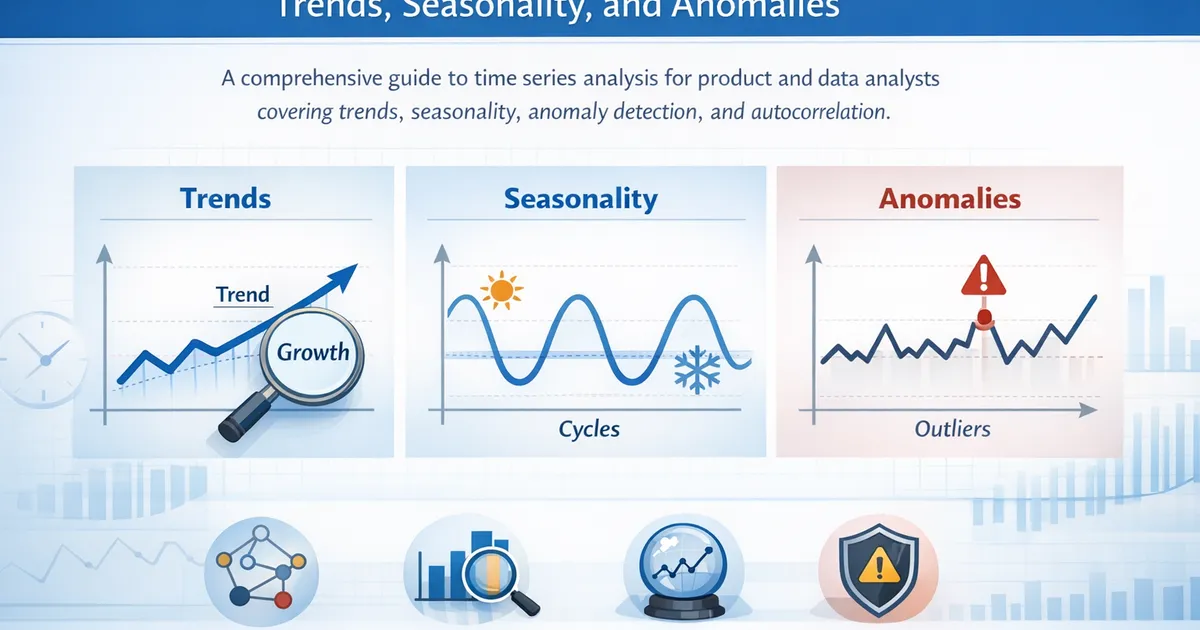
Detecting Trends in Metrics: Mann-Kendall, LOESS, and Change Points
How to statistically detect trends in product metrics using Mann-Kendall tests, LOESS smoothing, and change point analysis.
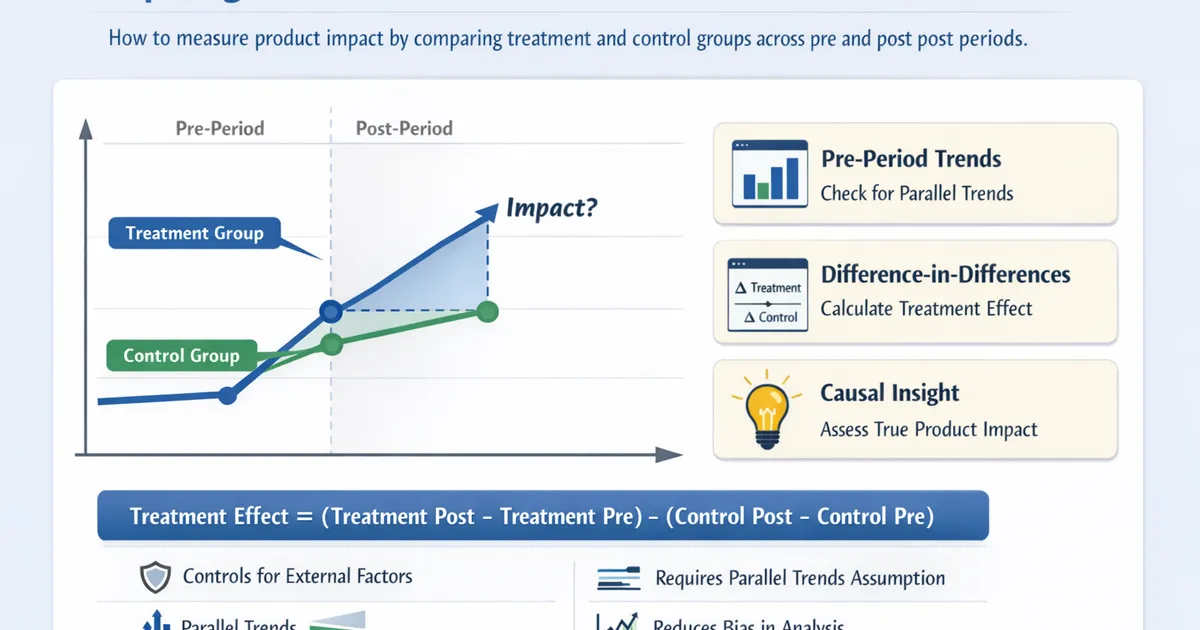
Comparing Pre/Post Periods: Difference-in-Differences for Product
How to use difference-in-differences to measure product impact by comparing treatment and control groups across pre and post periods.
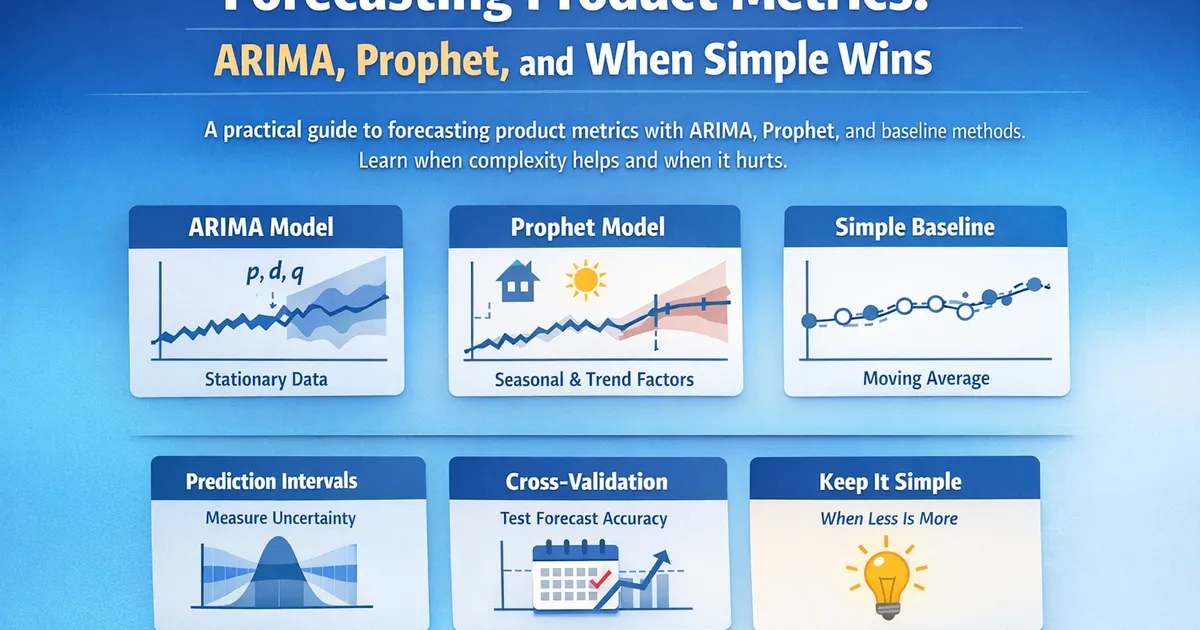
Forecasting Product Metrics: ARIMA, Prophet, and When Simple Wins
A practical guide to forecasting product metrics with ARIMA, Prophet, and baseline methods. Learn when complexity helps and when it hurts.
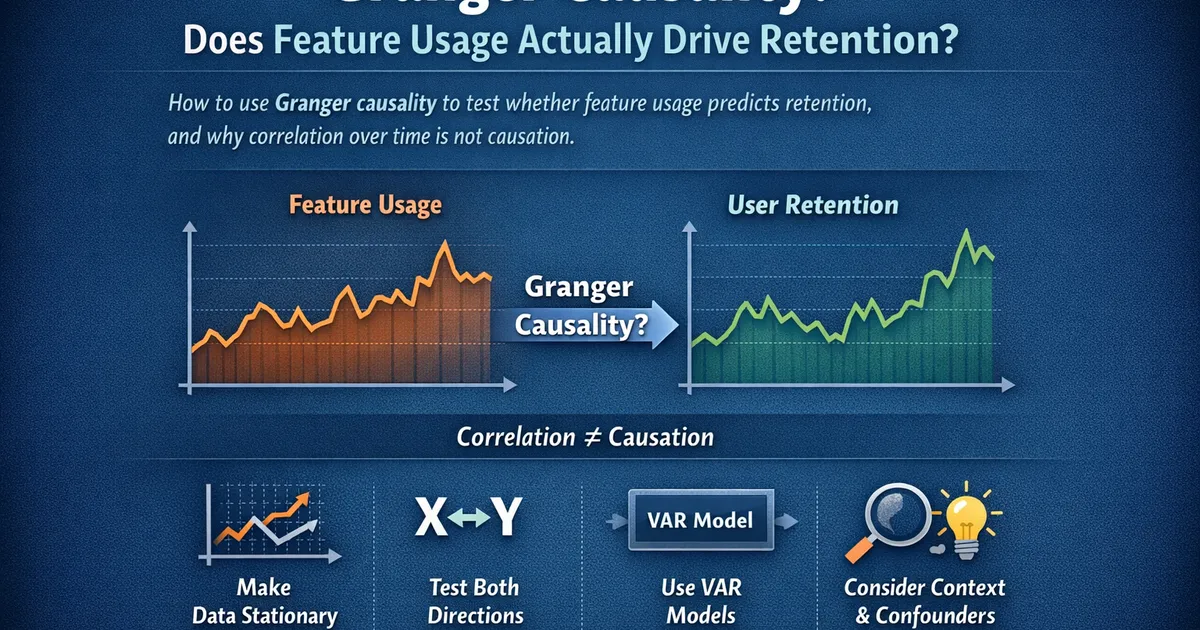
Granger Causality: Does Feature Usage Actually Drive Retention?
How to use Granger causality to test whether feature usage predicts retention, and why correlation over time is not causation.
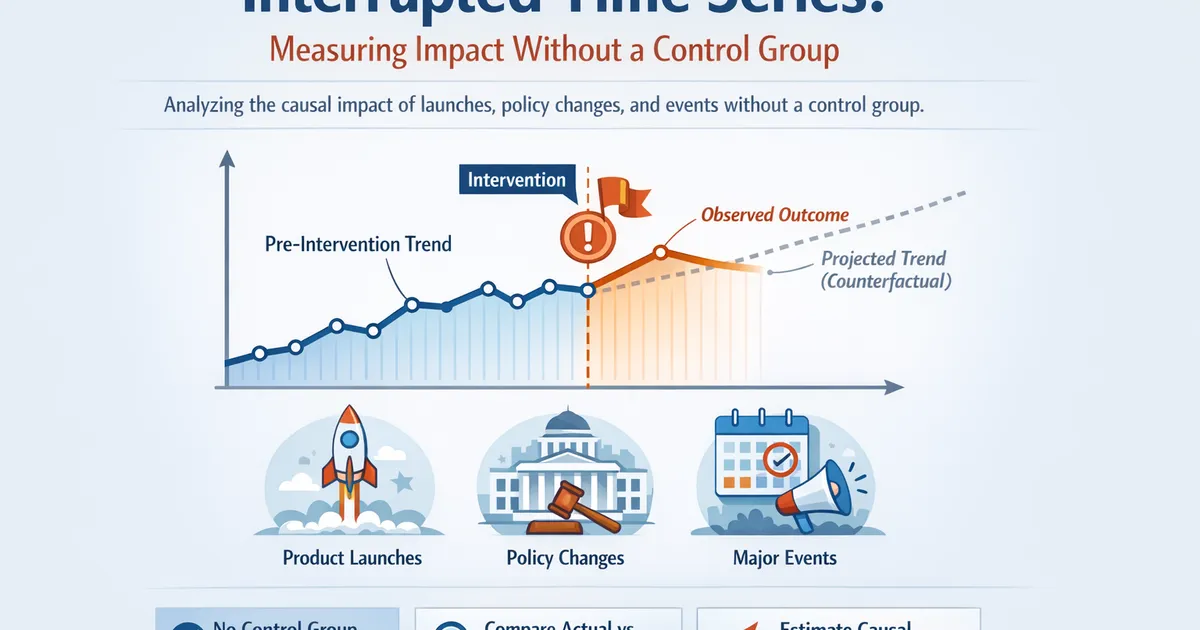
Interrupted Time Series: Measuring Impact Without a Control Group
How to use interrupted time series analysis to measure causal impact of launches, policy changes, and events without a control group.
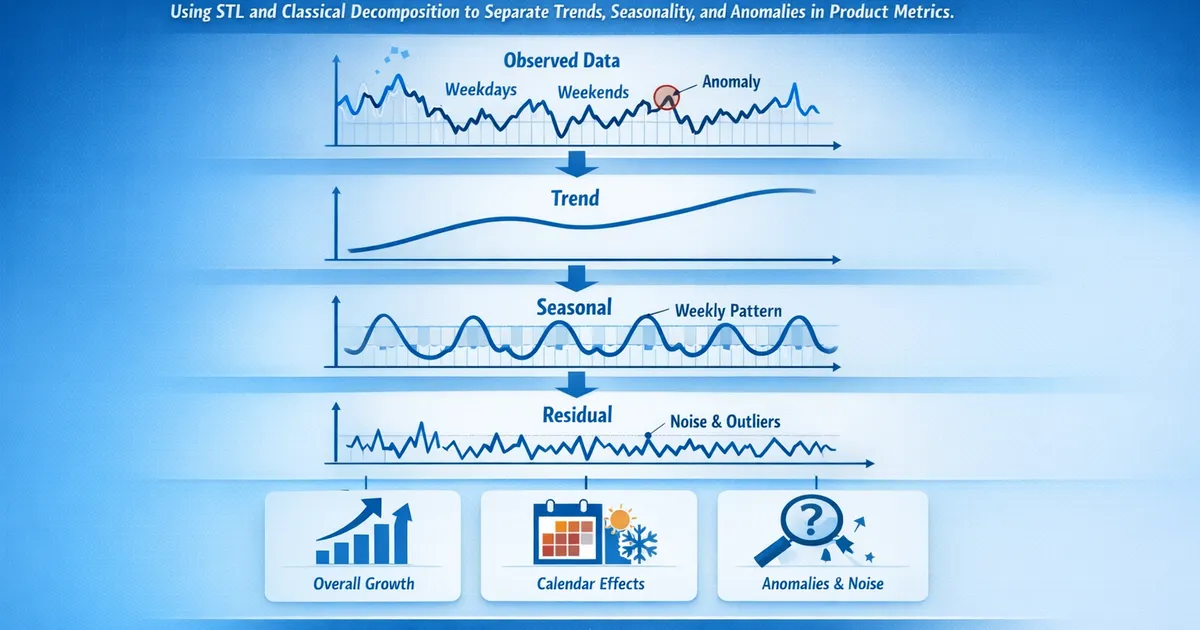
Seasonal Decomposition: Separating Signal from Calendar Effects
How to use STL and classical decomposition to separate trends, seasonality, and anomalies in product metrics.