StatsTest Blog
Experimental design, data analysis, and statistical tooling for modern teams. No hype, just the math.
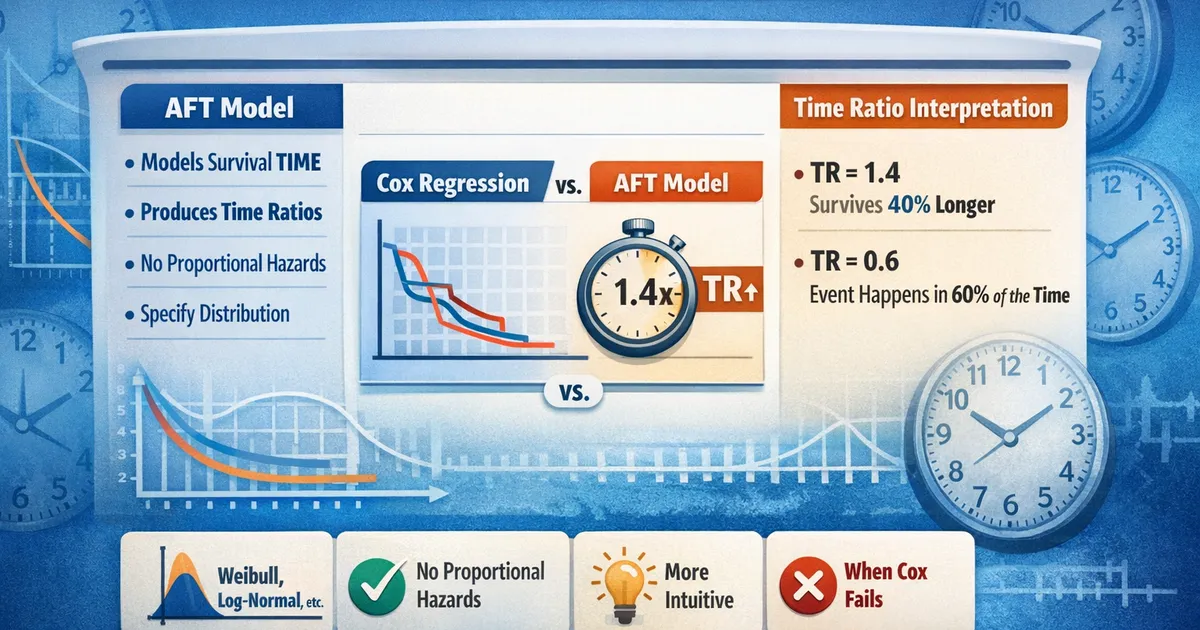
Accelerated Failure Time Models: When Cox Doesn't Fit
When proportional hazards fail, AFT models offer an interpretable alternative. Learn when to use accelerated failure time models, how to interpret time ratios, and how they compare to Cox regression.
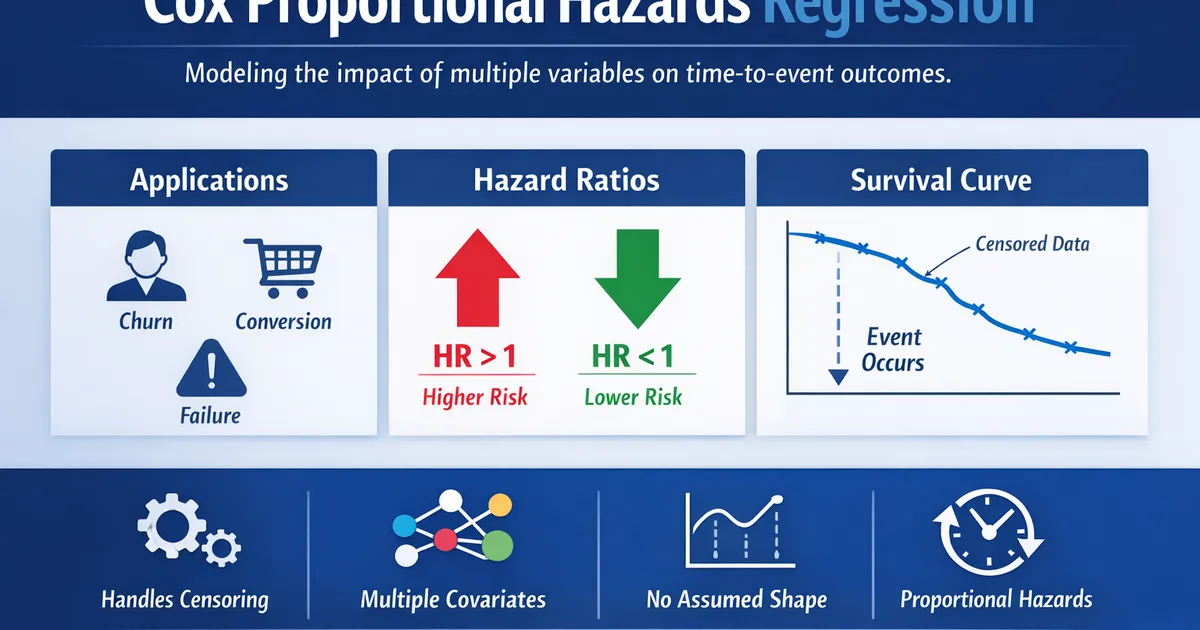
Cox Proportional Hazards Regression
Cox Proportional Hazards Regression models the effect of multiple variables on time-to-event outcomes. Use it to identify which factors accelerate or delay an event such as churn, conversion, or failure.
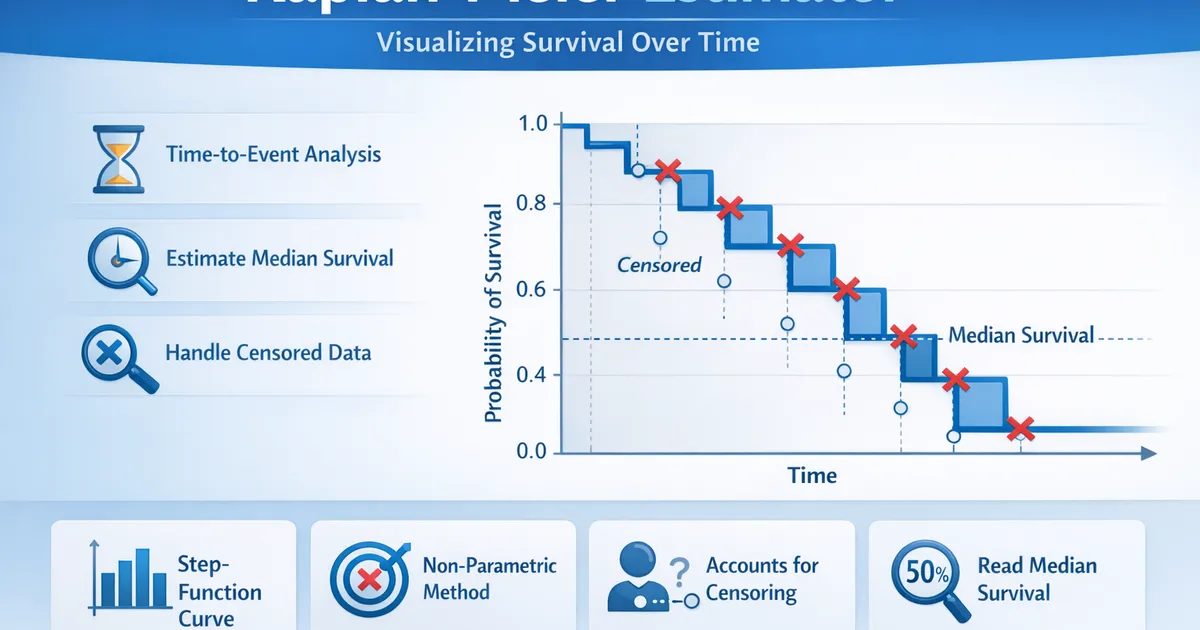
Kaplan-Meier Estimator
The Kaplan-Meier Estimator constructs a survival curve showing the probability of not experiencing an event over time. Use it to visualize retention, estimate median survival, and handle censored data.
Log-Rank Test
The Log-Rank Test compares survival curves between two or more groups. Use it when you want to know whether groups differ in their time to an event such as churn, conversion, or failure.
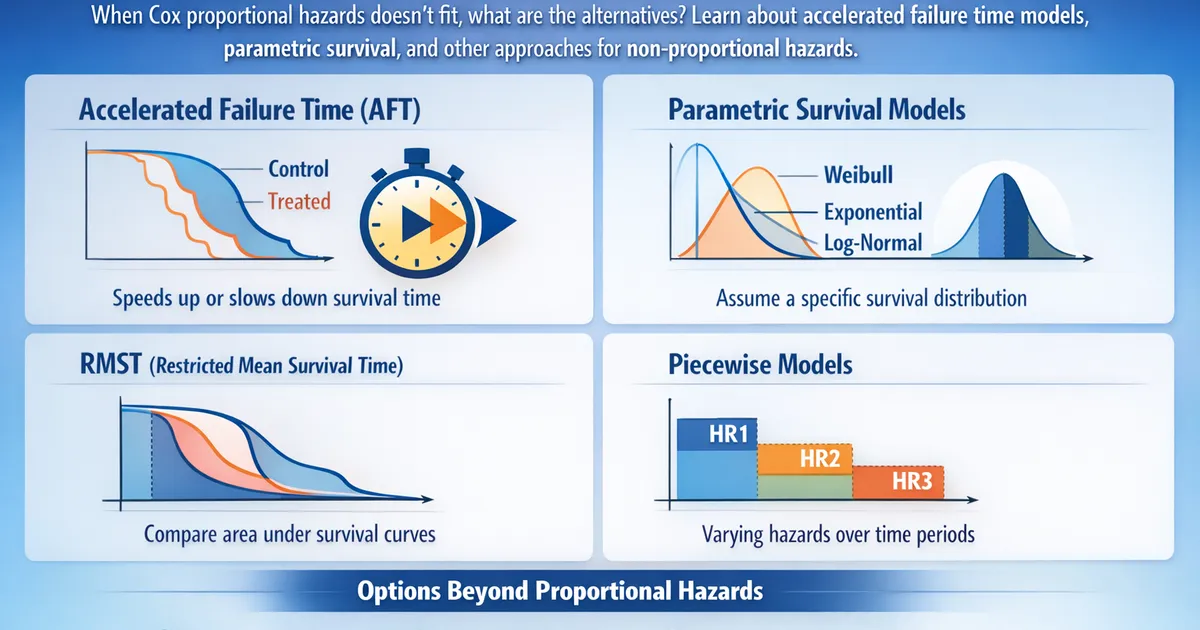
Alternatives to Cox: Accelerated Failure Time and Other Models
When Cox proportional hazards doesn't fit, what are the alternatives? Learn about accelerated failure time models, parametric survival, and other approaches for non-proportional hazards.
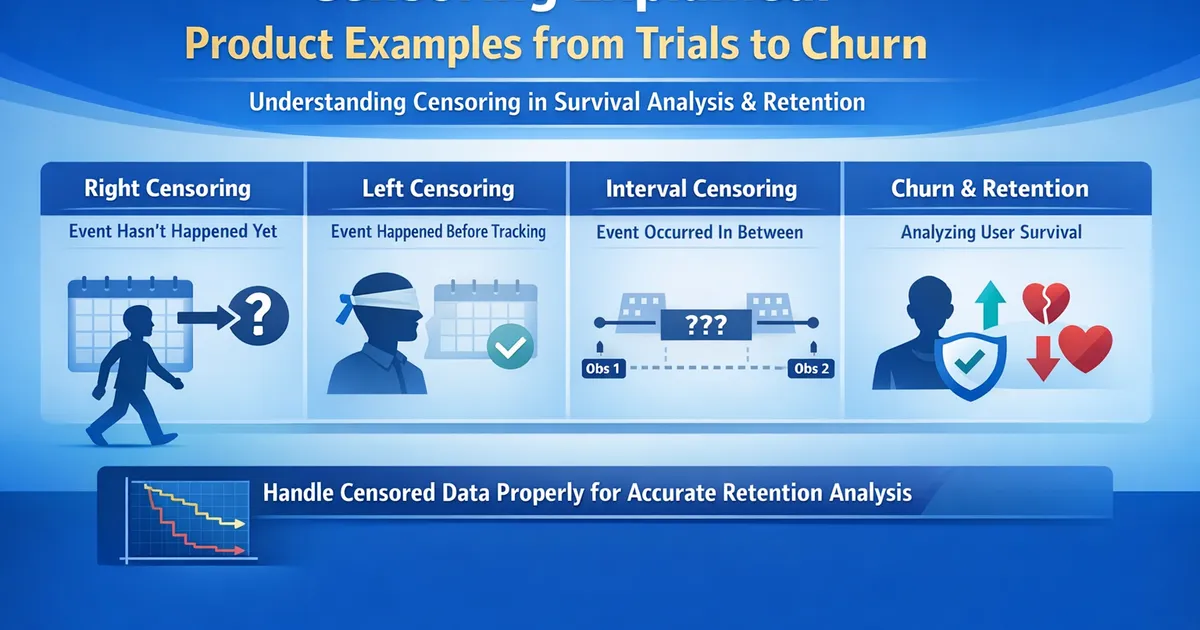
Censoring Explained: Product Examples from Trials to Churn
A practical guide to understanding censoring in survival analysis. Learn the different types of censoring, why it matters for retention analysis, and how to identify and handle censoring in your product data.
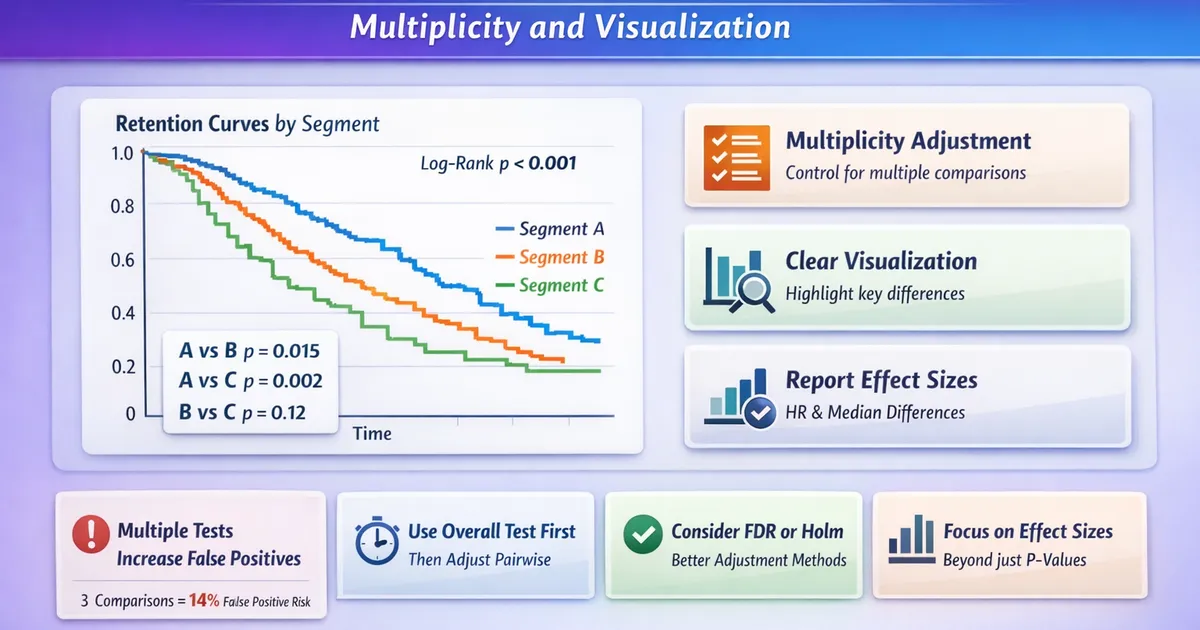
Comparing Retention Curves Across Segments: Multiplicity and Visualization
A practical guide to comparing survival curves across multiple segments. Learn how to visualize multiple retention curves, handle multiple comparisons, and communicate segment differences clearly.

Cox Proportional Hazards: What 'Proportional' Actually Means
A practical guide to Cox regression for product analysts. Learn what the proportional hazards assumption means, how to check it, what to do when it fails, and how to interpret hazard ratios correctly.
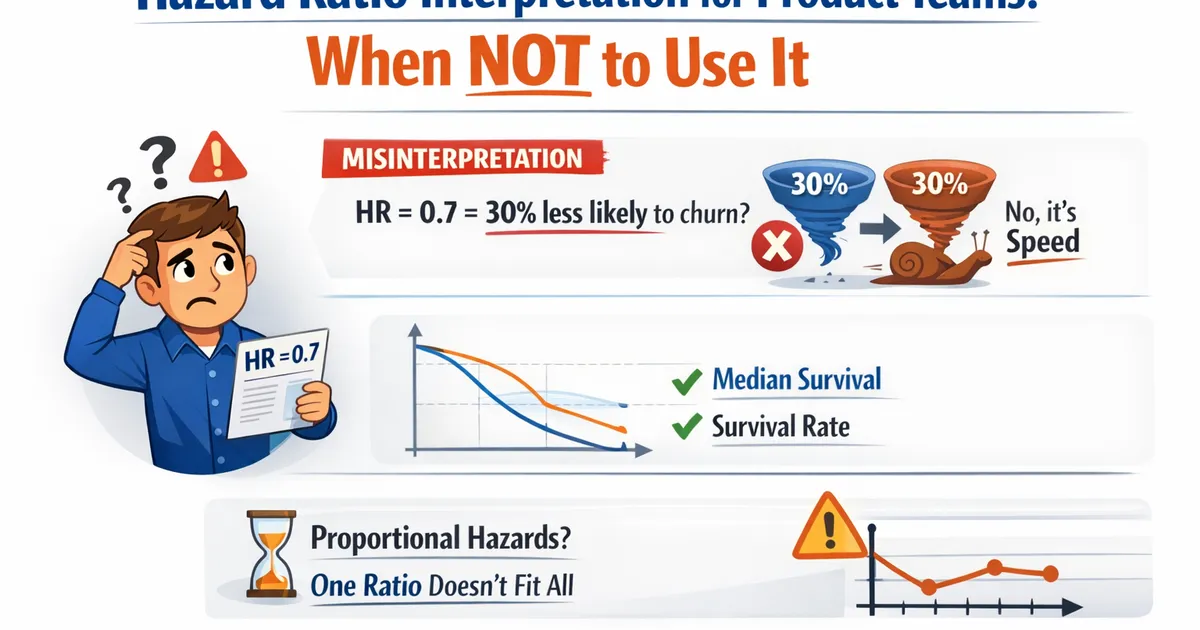
Hazard Ratio Interpretation for Product Teams: When NOT to Use It
A practical guide to interpreting hazard ratios for non-statisticians. Learn what hazard ratios actually mean, common misinterpretations, when they're misleading, and better alternatives for communicating survival results.
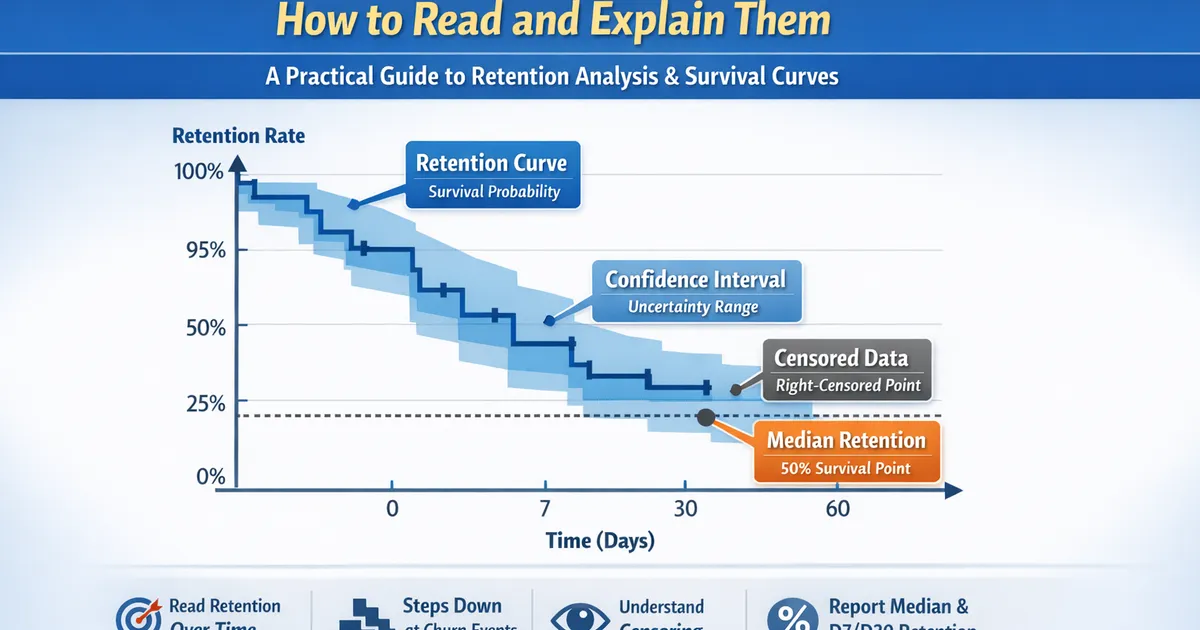
Kaplan-Meier Curves for Retention: How to Read and Explain Them
A practical guide to Kaplan-Meier survival curves for product retention analysis. Learn to create, interpret, and explain retention curves to stakeholders, with handling for censoring and confidence intervals.
Log-Rank Test: When It's Appropriate and Common Misuses
A practical guide to the log-rank test for comparing survival curves. Learn when it works, when it fails, and better alternatives when proportional hazards don't hold.
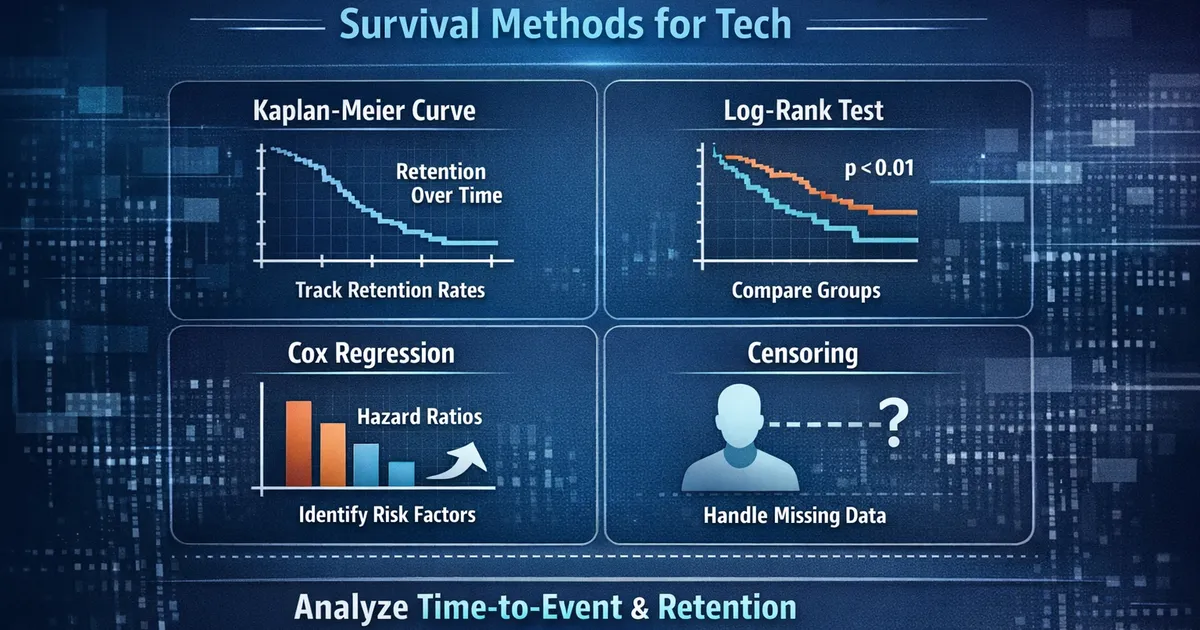
Time-to-Event and Retention Analysis: Survival Methods for Tech
A comprehensive guide to survival analysis for product analysts. Learn Kaplan-Meier curves for retention, log-rank tests for comparing groups, Cox regression for understanding drivers, and how to handle the unique challenges of tech product data.