Contents
Time-to-Event and Retention Analysis: Survival Methods for Tech
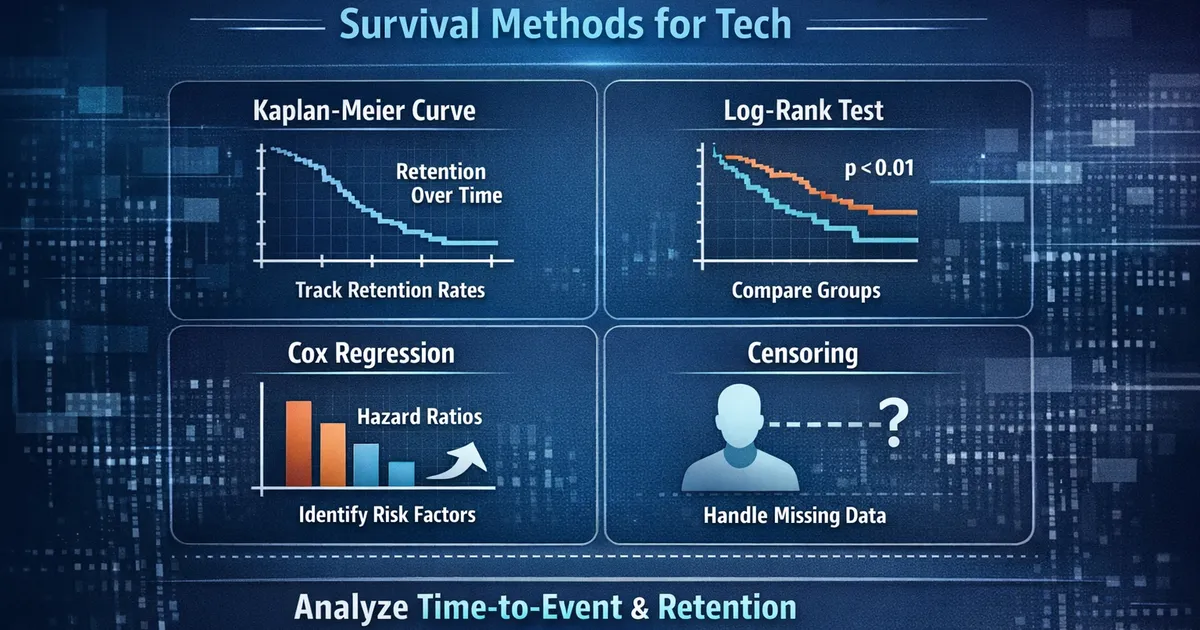
A comprehensive guide to survival analysis for product analysts. Learn Kaplan-Meier curves for retention, log-rank tests for comparing groups, Cox regression for understanding drivers, and how to handle the unique challenges of tech product data.
Quick Hits
- •Survival analysis handles 'how long until event?' with incomplete data
- •Censoring = we know they haven't churned YET, but don't know their final outcome
- •Kaplan-Meier curves show retention over time, handling censoring properly
- •Log-rank test compares survival curves between groups
- •Cox regression identifies factors that increase/decrease hazard (risk of event)
TL;DR
Survival analysis answers "how long until an event?" when not everyone has experienced the event yet. In tech, this means retention curves, time-to-conversion, time-to-feature-adoption, and more. The key challenge is censoring—users who haven't churned yet still provide information. Kaplan-Meier curves visualize survival over time, log-rank tests compare groups, and Cox regression identifies what drives faster or slower events.
Why Standard Methods Fail
The Problem
You want to know: "What's the typical time until users churn?"
Naive approach: Average time among users who churned.
Problem: This excludes users who haven't churned yet (censored), biasing your estimate.
Example:
- User A: Churned at day 30
- User B: Churned at day 45
- User C: Still active at day 60
Naive average: (30 + 45) / 2 = 37.5 days
But User C has already survived 60 days! They'll push the average higher when they eventually churn. Excluding them underestimates retention.
Survival Analysis Solution
Use all available information:
- User A: Event at day 30
- User B: Event at day 45
- User C: Censored at day 60 (survived at least 60 days)
Survival methods incorporate partial information from censored observations.
Core Concepts
The Event
The outcome you're tracking:
- Churn: User stops using the product
- Conversion: Free user becomes paid
- Feature adoption: User tries a specific feature
- Return: User comes back after inactivity
Time Origin
When the clock starts:
- Signup date: Time since registration
- Feature launch: Time since feature became available
- Experiment start: Time since randomization
Censoring
Censoring occurs when you don't observe the event:
Right censoring (most common):
- User hasn't churned by end of study
- User dropped out of observation (e.g., deleted account for unrelated reason)
Left censoring (rare):
- Event happened before observation started
- "How long since last purchase?" but user already purchased before tracking began
Interval censoring:
- Event happened between observations
- User was active Monday, churned by Friday (exact day unknown)
The Survival Function
Definition
- S(0) = 1 (everyone starts alive/retained)
- S(t) decreases over time (or stays flat)
- As t → ∞, S(t) → 0 (eventually everyone experiences the event)
The Hazard Function
Interpretation: Instantaneous risk of the event at time t, given survival to time t.
- High hazard = high risk of event right now
- Hazard can increase, decrease, or stay constant over time
Hazard vs. Survival
If you know hazard over time, you can derive survival (and vice versa).
Kaplan-Meier Estimation
The Method
Kaplan-Meier estimates the survival curve non-parametrically (no distributional assumptions).
Where:
- = time of the i-th event
- = number of events at time
- = number at risk just before time
Interpretation
At each event time, multiply the previous survival by (1 - event rate at that moment).
Example:
| Day | At Risk | Events | Survival |
|---|---|---|---|
| 0 | 100 | 0 | 1.000 |
| 7 | 100 | 5 | |
| 14 | 90 | 10 | |
| 21 | 75 | 8 |
Handling Censoring
Censored observations reduce the "at risk" count but don't create a step down in survival.
If 5 users are censored between day 14 and 21: At risk drops from 90-10=80 to 80-5=75 before day 21's events.
Comparing Survival Curves
Log-Rank Test
Tests whether survival curves differ between groups.
How it works: At each event time, compares observed vs. expected events in each group. Sums across all times.
Interpretation:
- Significant p-value → curves differ somewhere
- Doesn't specify where or how (early vs. late divergence)
Other Tests
| Test | Best When |
|---|---|
| Log-rank | Proportional hazards (curves don't cross) |
| Wilcoxon (Breslow) | Early differences matter more |
| Tarone-Ware | Compromise between log-rank and Wilcoxon |
| Peto-Peto | Heavy censoring |
Cox Proportional Hazards Regression
The Model
Where:
- = hazard at time t given covariates X
- = baseline hazard (unspecified shape)
- = log hazard ratios
Hazard Ratio Interpretation
Interpretation: For a one-unit increase in , the hazard is multiplied by HR.
- : No effect
- : Higher hazard → faster events (worse retention)
- : Lower hazard → slower events (better retention)
Example: If premium users have for churn:
- Premium users have 40% lower hazard of churning at any given time
- They churn more slowly
The Proportional Hazards Assumption
The model assumes hazard ratios are constant over time.
Example (valid): Premium reduces hazard by 40% at day 7, day 30, day 90...
Example (violation): Premium reduces hazard by 40% early but no effect after day 90.
Check: Plot Schoenfeld residuals or log(-log(S(t))) curves.
Code: Complete Survival Analysis
Python
import numpy as np
import pandas as pd
from lifelines import KaplanMeierFitter, CoxPHFitter
from lifelines.statistics import logrank_test
import matplotlib.pyplot as plt


def generate_survival_data(n=500, seed=42):
    """Generate example survival data with censoring."""
    np.random.seed(seed)

    # Covariates
    premium = np.random.binomial(1, 0.3, n)
    tenure_months = np.random.exponential(12, n)
    engagement_score = np.random.normal(50, 15, n)

    # True hazard model
    # Premium users have lower hazard (HR=0.6), higher engagement = lower hazard
    log_hazard = -3 + (-0.5) * premium + (-0.02) * engagement_score + 0.01 * tenure_months
    hazard = np.exp(log_hazard)

    # Generate survival times (exponential baseline)
    survival_time = np.random.exponential(1/hazard)

    # Censoring (administrative at day 180)
    observed_time = np.minimum(survival_time, 180)
    event = (survival_time <= 180).astype(int)

    return pd.DataFrame({
        'time': observed_time,
        'event': event,
        'premium': premium,
        'tenure_months': tenure_months,
        'engagement_score': engagement_score
    })


def kaplan_meier_analysis(data, time_col='time', event_col='event',
                          group_col=None, figsize=(10, 6)):
    """
    Kaplan-Meier survival analysis.

    Parameters:
    -----------
    data : pd.DataFrame
        Dataset with time and event columns
    time_col : str
        Column name for time variable
    event_col : str
        Column name for event indicator (1=event, 0=censored)
    group_col : str, optional
        Column name for grouping variable

    Returns:
    --------
    dict with KM results and figure
    """
    fig, ax = plt.subplots(figsize=figsize)
    results = {}

    if group_col is None:
        # Single survival curve
        kmf = KaplanMeierFitter()
        kmf.fit(data[time_col], data[event_col], label='Overall')
        kmf.plot_survival_function(ax=ax, ci_show=True)

        results['kmf'] = kmf
        results['median_survival'] = kmf.median_survival_time_
        results['survival_at_30'] = kmf.survival_function_at_times(30).values[0]
        results['survival_at_90'] = kmf.survival_function_at_times(90).values[0]

    else:
        # Survival curves by group
        groups = data[group_col].unique()
        kmf_dict = {}

        for group in sorted(groups):
            subset = data[data[group_col] == group]
            kmf = KaplanMeierFitter()
            kmf.fit(subset[time_col], subset[event_col], label=f'{group_col}={group}')
            kmf.plot_survival_function(ax=ax, ci_show=True)
            kmf_dict[group] = kmf

        results['kmf_by_group'] = kmf_dict

        # Log-rank test
        if len(groups) == 2:
            g1, g2 = sorted(groups)
            lr_result = logrank_test(
                data[data[group_col] == g1][time_col],
                data[data[group_col] == g2][time_col],
                data[data[group_col] == g1][event_col],
                data[data[group_col] == g2][event_col]
            )
            results['logrank'] = {
                'test_statistic': lr_result.test_statistic,
                'p_value': lr_result.p_value
            }

    ax.set_xlabel('Time (days)')
    ax.set_ylabel('Survival Probability')
    ax.set_title('Kaplan-Meier Survival Curve')
    ax.legend(loc='lower left')
    ax.set_ylim(0, 1)

    results['figure'] = fig
    return results


def cox_regression_analysis(data, time_col='time', event_col='event',
                            covariates=None):
    """
    Cox proportional hazards regression.

    Parameters:
    -----------
    data : pd.DataFrame
        Dataset
    time_col : str
        Time variable
    event_col : str
        Event indicator
    covariates : list
        List of covariate column names

    Returns:
    --------
    dict with Cox model results
    """
    if covariates is None:
        covariates = [c for c in data.columns if c not in [time_col, event_col]]

    # Prepare data
    model_data = data[[time_col, event_col] + covariates].copy()

    # Fit Cox model
    cph = CoxPHFitter()
    cph.fit(model_data, duration_col=time_col, event_col=event_col)

    # Extract hazard ratios
    hr_df = pd.DataFrame({
        'Variable': cph.params_.index,
        'Coefficient': cph.params_.values,
        'Hazard Ratio': np.exp(cph.params_.values),
        'HR CI Lower': np.exp(cph.confidence_intervals_['95% lower-bound'].values),
        'HR CI Upper': np.exp(cph.confidence_intervals_['95% upper-bound'].values),
        'P-value': cph.summary['p'].values
    })

    # Check proportional hazards
    ph_test = cph.check_assumptions(model_data, show_plots=False, p_value_threshold=0.05)

    return {
        'model': cph,
        'hazard_ratios': hr_df,
        'summary': cph.summary,
        'concordance': cph.concordance_index_,
        'ph_assumption_test': ph_test
    }


# Example usage
if __name__ == "__main__":
    # Generate data
    data = generate_survival_data(n=500)

    print("Survival Analysis Example")
    print("=" * 60)
    print(f"Sample size: {len(data)}")
    print(f"Events observed: {data['event'].sum()}")
    print(f"Censoring rate: {1 - data['event'].mean():.1%}")

    # Kaplan-Meier overall
    print("\n" + "=" * 60)
    print("Kaplan-Meier (Overall)")
    km_results = kaplan_meier_analysis(data)
    print(f"Median survival time: {km_results['median_survival']:.1f} days")
    print(f"30-day survival: {km_results['survival_at_30']:.1%}")
    print(f"90-day survival: {km_results['survival_at_90']:.1%}")

    # Kaplan-Meier by premium
    print("\n" + "=" * 60)
    print("Kaplan-Meier (by Premium Status)")
    km_group = kaplan_meier_analysis(data, group_col='premium')
    print(f"Log-rank test p-value: {km_group['logrank']['p_value']:.4f}")

    # Cox regression
    print("\n" + "=" * 60)
    print("Cox Proportional Hazards Regression")
    cox_results = cox_regression_analysis(
        data,
        covariates=['premium', 'tenure_months', 'engagement_score']
    )
    print("\nHazard Ratios:")
    print(cox_results['hazard_ratios'].to_string(index=False))
    print(f"\nConcordance index: {cox_results['concordance']:.3f}")

    plt.show()
R
library(tidyverse)
library(survival)
library(survminer)


generate_survival_data <- function(n = 500, seed = 42) {
    #' Generate example survival data

    set.seed(seed)

    premium <- rbinom(n, 1, 0.3)
    tenure_months <- rexp(n, 1/12)
    engagement_score <- rnorm(n, 50, 15)

    # True hazard
    log_hazard <- -3 + (-0.5) * premium + (-0.02) * engagement_score + 0.01 * tenure_months
    hazard <- exp(log_hazard)

    # Survival times
    survival_time <- rexp(n, hazard)

    # Censoring at 180 days
    observed_time <- pmin(survival_time, 180)
    event <- as.integer(survival_time <= 180)

    tibble(
        time = observed_time,
        event = event,
        premium = premium,
        tenure_months = tenure_months,
        engagement_score = engagement_score
    )
}


# Generate data
data <- generate_survival_data(500)

cat("Survival Analysis Example\n")
cat(strrep("=", 60), "\n")
cat(sprintf("Sample size: %d\n", nrow(data)))
cat(sprintf("Events observed: %d\n", sum(data$event)))
cat(sprintf("Censoring rate: %.1f%%\n", (1 - mean(data$event)) * 100))

# Create survival object
surv_obj <- Surv(data$time, data$event)

# Kaplan-Meier (overall)
cat("\n", strrep("=", 60), "\n")
cat("Kaplan-Meier (Overall)\n")
km_fit <- survfit(surv_obj ~ 1, data = data)
print(summary(km_fit, times = c(30, 60, 90, 180)))

# Plot
ggsurvplot(km_fit, data = data,
           conf.int = TRUE,
           risk.table = TRUE,
           xlab = "Time (days)",
           ylab = "Survival Probability")

# Kaplan-Meier by premium
cat("\n", strrep("=", 60), "\n")
cat("Kaplan-Meier by Premium Status\n")
km_premium <- survfit(surv_obj ~ premium, data = data)

ggsurvplot(km_premium, data = data,
           conf.int = TRUE,
           risk.table = TRUE,
           pval = TRUE,
           legend.labs = c("Non-Premium", "Premium"),
           xlab = "Time (days)")

# Log-rank test
cat("\nLog-rank test:\n")
lr_test <- survdiff(surv_obj ~ premium, data = data)
print(lr_test)

# Cox regression
cat("\n", strrep("=", 60), "\n")
cat("Cox Proportional Hazards Regression\n")
cox_model <- coxph(surv_obj ~ premium + tenure_months + engagement_score, data = data)
print(summary(cox_model))

# Hazard ratios with CI
hr_table <- tibble(
    Variable = names(coef(cox_model)),
    `Hazard Ratio` = exp(coef(cox_model)),
    `HR CI Lower` = exp(confint(cox_model))[, 1],
    `HR CI Upper` = exp(confint(cox_model))[, 2],
    `P-value` = summary(cox_model)$coefficients[, "Pr(>|z|)"]
)
print(hr_table)

# Check proportional hazards
cat("\nProportional Hazards Test:\n")
ph_test <- cox.zph(cox_model)
print(ph_test)
Product Analytics Applications
1. Retention Curves
Question: What's our D7, D30, D90 retention?
Approach: Kaplan-Meier with churn as event, signup as time origin.
2. Time to First Purchase
Question: How long until new users make their first purchase?
Approach: Survival analysis with purchase as event. Many users never purchase (heavy censoring)—that's fine.
3. A/B Test on Retention
Question: Does the new onboarding improve retention?
Approach: Kaplan-Meier by treatment group + log-rank test. Cox regression if you need to control for covariates.
4. Churn Risk Factors
Question: What predicts faster churn?
Approach: Cox regression with user characteristics as covariates. Hazard ratios show relative risk.
5. Feature Adoption
Question: How quickly do users adopt Feature X?
Approach: Time-to-adoption analysis. Users who never adopt are censored.
Common Pitfalls
Pitfall 1: Ignoring Censoring
Wrong: Calculate average time-to-churn only among churned users.
Right: Use Kaplan-Meier or Cox regression, which properly handles censored observations.
Pitfall 2: Treating Survival at Day X as a Proportion
Wrong: "50% of users are retained at day 30" calculated as (users active at day 30) / (total users)
Problem: Doesn't account for users who signed up recently and haven't had 30 days yet.
Right: Use Kaplan-Meier estimate at day 30, which handles varying observation periods.
Pitfall 3: Violating Proportional Hazards
Wrong: Use Cox regression when hazard ratios change over time.
Right: Check proportional hazards assumption. If violated, consider stratified Cox, time-varying coefficients, or parametric models.
Pitfall 4: Immortal Time Bias
Wrong: Compare survival of users who "adopted Feature X" vs. those who didn't, with adoption measured at any time.
Problem: Users must survive long enough to adopt the feature. Attributing their pre-adoption survival to the feature biases results.
Right: Use time-varying covariates (adoption status changes from 0 to 1 at adoption time) or landmark analysis.
Related Articles in This Cluster
Core Methods
- Kaplan-Meier for Retention - Deep dive on KM curves
- Log-Rank Test - Comparing survival curves
- Cox Proportional Hazards - Regression approach
Interpretation
- Hazard Ratio Interpretation - What HRs mean
- Censoring Explained - Types and handling
Extensions
- Comparing Retention Curves - Multiple groups
- Alternatives to Cox - When Cox doesn't fit
- Sample Size for Time-to-Event - Planning studies
Key Takeaway
Survival analysis is the right tool whenever you're asking "how long until X?" with incomplete data. It correctly handles users who haven't experienced the event yet (censoring), enabling valid retention curves, time-to-event comparisons, and risk factor analysis. Kaplan-Meier gives you the survival curve, log-rank tests compare groups, and Cox regression quantifies risk factors. The key concepts—censoring, hazard, and the proportional hazards assumption—are fundamental to doing this right.
References
- https://www.ncbi.nlm.nih.gov/pmc/articles/PMC3059453/
- https://lifelines.readthedocs.io/
- https://cran.r-project.org/web/packages/survival/vignettes/survival.pdf
- Clark, T. G., Bradburn, M. J., Love, S. B., & Altman, D. G. (2003). Survival analysis part I: basic concepts and first analyses. *British Journal of Cancer*, 89(2), 232-238.
- Davidson-Pilon, C. (2019). lifelines: survival analysis in Python. *Journal of Open Source Software*, 4(40), 1317.
- Therneau, T. M., & Grambsch, P. M. (2000). Modeling survival data: extending the Cox model. Springer.
Frequently Asked Questions
Why can't I just use the average time to churn?
What's the difference between survival and retention?
When should I use Kaplan-Meier vs. Cox regression?
Key Takeaway
Survival analysis is essential whenever you're asking 'how long until X happens?' in the presence of incomplete data. It correctly handles users who haven't experienced the event yet (censoring), compares time-to-event across groups, and identifies factors that accelerate or delay events.