Contents
Hazard Ratio Interpretation for Product Teams: When NOT to Use It
A practical guide to interpreting hazard ratios for non-statisticians. Learn what hazard ratios actually mean, common misinterpretations, when they're misleading, and better alternatives for communicating survival results.
Quick Hits
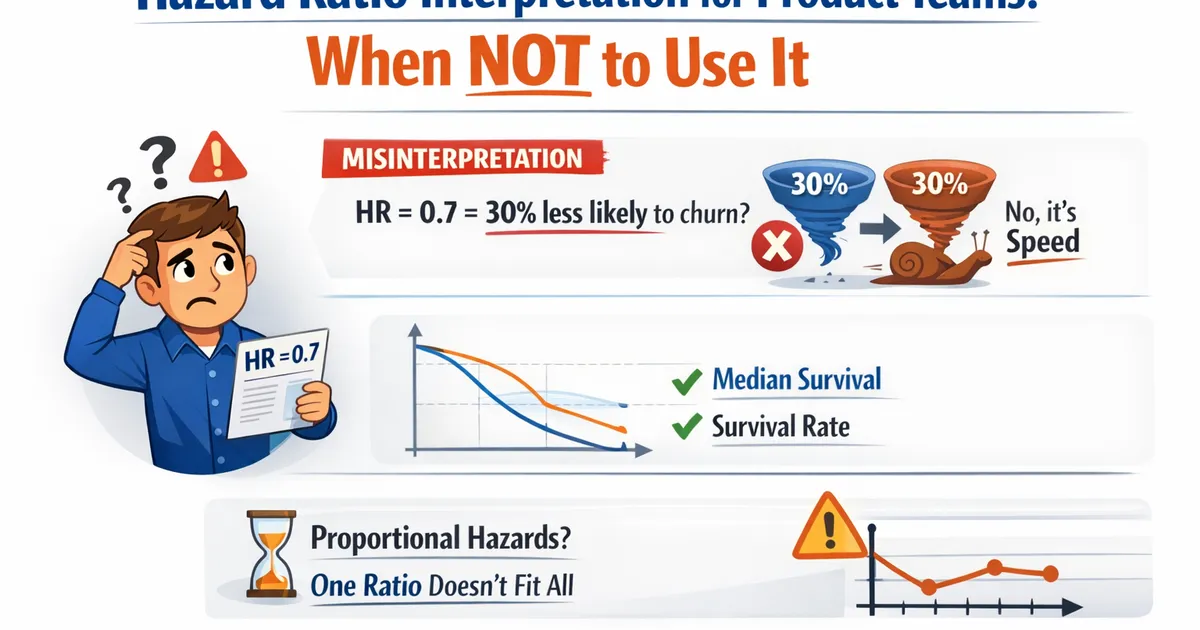
- •HR = 0.7 means 30% lower hazard (instantaneous risk), NOT 30% less likely to churn
- •Hazard is about SPEED of events, not probability of events
- •HR ≠ Risk Ratio - don't interpret like one
- •For stakeholders, median survival difference or survival at day X is usually clearer
- •HR requires proportional hazards - one number only works if ratio is constant
TL;DR
Hazard ratios measure the relative speed of events, not the relative probability of events occurring. HR = 0.7 means "30% slower to churn" not "30% less likely to churn." For product teams, hazard ratios are often harder to act on than simpler metrics like median survival difference or retention at day 30. Know when HR is appropriate, when it's misleading, and how to translate it into actionable insights.
What Hazard Ratio Actually Means
The Definition
Hazard = instantaneous risk of the event among those who haven't yet experienced it.
Hazard ratio = how many times faster/slower events happen in one group vs. another.
What It DOESN'T Mean
| HR | Common Misinterpretation | Actual Meaning |
|---|---|---|
| 0.7 | "30% less likely to churn" | "Churning 30% more slowly at any given moment" |
| 2.0 | "Twice as likely to churn" | "Churning twice as fast" |
| 1.0 | "Same probability of churn" | "Same rate of churn over time" |
A Traffic Analogy
Think of HR like relative speed limits:
- HR = 0.5: "This group is driving at 50 mph in a 100 mph zone"
- HR = 2.0: "This group is driving at 200 mph in a 100 mph zone"
Slower speed (lower HR) means it takes longer to reach the destination (event), but it doesn't tell you whether they'll ever arrive.
When Hazard Ratio Works Well
Ideal Conditions
- Proportional hazards hold: The speed difference is constant over time
- You care about rate: "How fast are users churning?" is the question
- Events will eventually happen: Most people will experience the event eventually
- Audience understands HR: Technical audience familiar with survival analysis
Good Use Cases
- Comparing treatment effects in clinical trials (standard practice)
- Summarizing Cox regression results for statistical reports
- When you need to control for multiple covariates
- When absolute differences vary but relative differences are constant
When Hazard Ratio Fails
Problem 1: Non-Proportional Hazards
When the HR changes over time, a single number is meaningless.
Example: New onboarding reduces churn by 50% in the first week (HR=0.5), but has no effect after (HR=1.0).
- Overall HR might be 0.7
- But this doesn't represent the effect at any time
Problem 2: Extreme Hazard Ratios
HR relates to hazard, not cumulative probability. With low baseline hazard:
| Baseline risk | HR = 2.0 | Actual cumulative effect |
|---|---|---|
| 1% | 2× hazard | ~2% (approximately 2×) |
| 30% | 2× hazard | ~50% (not 60%!) |
| 50% | 2× hazard | ~75% (not 100%!) |
As baseline gets higher, HR=2 translates to smaller relative risk increases.
Problem 3: When Probability Matters More
Sometimes you care about "how many will churn?" not "how fast will they churn?"
Scenario: Two treatments both lead to 50% eventually churning
- Treatment A: HR=0.5 (slow churn)
- Treatment B: HR=2.0 (fast churn)
If you only care about total churn, not timing, HR is irrelevant!
Problem 4: Stakeholder Comprehension
Product managers, executives, and most business stakeholders don't think in hazard ratios.
HR = 0.65: ??? "Premium users stay 35% longer on average": Clear and actionable
Better Metrics for Communication
Median Survival Time Difference
"Control group has median retention of 45 days; treatment has 72 days."
Why it works:
- Intuitive (time units people understand)
- Directly comparable
- Doesn't require understanding hazard
Survival at Key Time Points
"At 30 days: 65% treatment vs 55% control retained" "At 90 days: 45% treatment vs 35% control retained"
Why it works:
- Percentages are familiar
- Matches common KPIs (D30, D90 retention)
- Shows where differences exist
Restricted Mean Survival Time (RMST)
"On average, treatment users are retained 12 extra days over the first 6 months"
Why it works:
- Summarizes entire curve into one number
- Interpretable as "extra time gained"
- Doesn't require proportional hazards
Absolute Risk Reduction
"Treatment reduces 30-day churn from 45% to 35% (10 percentage point reduction)"
Why it works:
- Directly answers "how many fewer will churn?"
- Enables NNT calculation (need to treat 10 users for 1 fewer churn)
Converting Hazard Ratio to Useful Numbers
HR to Median Survival Ratio (Under Exponential)
If events follow exponential distribution:
So HR = 0.7 means median survival is 1/0.7 = 1.43× longer.
Caution: This is approximate and assumes exponential survival.
HR to Risk Ratio at Time t
For rare events (low cumulative probability):
For more common events, use:
Calculate from actual survival curves, not from HR alone.
HR to RMST Difference
Calculate directly from survival curves:
Code: From HR to Useful Metrics
Python
import numpy as np
import pandas as pd
from lifelines import KaplanMeierFitter, CoxPHFitter


def hr_to_useful_metrics(data, time_col, event_col, group_col, horizon=90):
    """
    Convert hazard ratio to more interpretable metrics.

    Parameters:
    -----------
    data : pd.DataFrame
        Dataset
    time_col : str
        Time variable
    event_col : str
        Event indicator
    group_col : str
        Binary group variable (0=control, 1=treatment)
    horizon : int
        Time horizon for RMST calculation

    Returns:
    --------
    dict with various effect measures
    """
    results = {}

    groups = sorted(data[group_col].unique())
    control = groups[0]
    treatment = groups[1]

    # Fit Cox for HR
    cph = CoxPHFitter()
    model_data = data[[time_col, event_col, group_col]].copy()
    cph.fit(model_data, duration_col=time_col, event_col=event_col)

    hr = np.exp(cph.params_[group_col])
    hr_ci = np.exp(cph.confidence_intervals_.values.flatten())

    results['hazard_ratio'] = {
        'hr': hr,
        'ci_lower': hr_ci[0],
        'ci_upper': hr_ci[1]
    }

    # Fit KM for each group
    kmf_dict = {}
    for g in groups:
        kmf = KaplanMeierFitter()
        mask = data[group_col] == g
        kmf.fit(data.loc[mask, time_col], data.loc[mask, event_col])
        kmf_dict[g] = kmf

    # Median survival
    med_control = kmf_dict[control].median_survival_time_
    med_treatment = kmf_dict[treatment].median_survival_time_

    results['median_survival'] = {
        'control': med_control,
        'treatment': med_treatment,
        'difference': med_treatment - med_control if pd.notna(med_control) and pd.notna(med_treatment) else None,
        'ratio': med_treatment / med_control if pd.notna(med_control) and pd.notna(med_treatment) and med_control > 0 else None
    }

    # Survival at key time points
    results['survival_at_time'] = {}
    for t in [7, 14, 30, 60, 90]:
        if t <= data[time_col].max():
            s_control = kmf_dict[control].survival_function_at_times(t).values[0]
            s_treatment = kmf_dict[treatment].survival_function_at_times(t).values[0]
            results['survival_at_time'][f'D{t}'] = {
                'control': s_control,
                'treatment': s_treatment,
                'difference': s_treatment - s_control,
                'risk_ratio': (1-s_treatment) / (1-s_control) if s_control < 1 else None
            }

    # RMST
    from lifelines import restricted_mean_survival_time
    rmst_control = restricted_mean_survival_time(kmf_dict[control], t=horizon)
    rmst_treatment = restricted_mean_survival_time(kmf_dict[treatment], t=horizon)

    results['rmst'] = {
        'control': rmst_control,
        'treatment': rmst_treatment,
        'difference': rmst_treatment - rmst_control,
        'horizon': horizon
    }

    return results


def explain_for_stakeholders(results, control_name='Control', treatment_name='Treatment'):
    """
    Generate plain-English summary for stakeholders.
    """
    lines = []

    # Don't lead with HR
    med = results['median_survival']
    if med['difference'] is not None:
        lines.append(f"**Key Finding**: {treatment_name} users stay {med['difference']:.0f} days longer on average.")
        lines.append(f"  - {control_name} median retention: {med['control']:.0f} days")
        lines.append(f"  - {treatment_name} median retention: {med['treatment']:.0f} days")

    # Retention at key points
    lines.append("\n**Retention Comparison**:")
    for time_label, data in results['survival_at_time'].items():
        diff_pp = data['difference'] * 100
        sign = '+' if diff_pp > 0 else ''
        lines.append(f"  - {time_label}: {treatment_name} {data['treatment']:.1%} vs {control_name} {data['control']:.1%} ({sign}{diff_pp:.1f}pp)")

    # RMST
    rmst = results['rmst']
    lines.append(f"\n**Expected Retention Time** (over {rmst['horizon']} days):")
    lines.append(f"  - {treatment_name} users stay {rmst['difference']:.1f} days longer on average")

    # HR (technical footnote)
    hr = results['hazard_ratio']
    lines.append(f"\n_Technical: Hazard Ratio = {hr['hr']:.2f} (95% CI: {hr['ci_lower']:.2f}-{hr['ci_upper']:.2f})_")
    if hr['hr'] < 1:
        lines.append(f"_Interpretation: {treatment_name} users churn {(1-hr['hr'])*100:.0f}% more slowly at any given time._")
    else:
        lines.append(f"_Interpretation: {treatment_name} users churn {(hr['hr']-1)*100:.0f}% faster at any given time._")

    return "\n".join(lines)


# Example
if __name__ == "__main__":
    np.random.seed(42)
    n = 1000

    # Generate data
    group = np.array([0] * (n//2) + [1] * (n//2))
    # HR = 0.7 (treatment churns 30% slower)
    hazard = np.where(group == 0, 0.02, 0.014)
    survival_time = np.random.exponential(1/hazard)

    censor_time = np.random.exponential(100, n)
    observed_time = np.minimum(survival_time, censor_time)
    event = (survival_time <= censor_time).astype(int)

    data = pd.DataFrame({
        'time': observed_time,
        'event': event,
        'treatment': group
    })

    # Get metrics
    results = hr_to_useful_metrics(data, 'time', 'event', 'treatment', horizon=90)

    # Print stakeholder summary
    print(explain_for_stakeholders(results, 'Control', 'Premium'))
R
library(tidyverse)
library(survival)
library(survRM2)  # For RMST


hr_to_useful_metrics <- function(data, time_col, event_col, group_col, horizon = 90) {
    #' Convert hazard ratio to interpretable metrics

    # Cox model for HR
    formula <- as.formula(sprintf("Surv(%s, %s) ~ %s", time_col, event_col, group_col))
    cox_model <- coxph(formula, data = data)

    hr <- exp(coef(cox_model))
    hr_ci <- exp(confint(cox_model))

    # KM fits
    km_formula <- as.formula(sprintf("Surv(%s, %s) ~ %s", time_col, event_col, group_col))
    km_fit <- survfit(km_formula, data = data)

    # Median survival
    med_surv <- surv_median(km_fit)

    # Survival at time points
    surv_summary <- summary(km_fit, times = c(7, 14, 30, 60, 90))

    # RMST
    rmst_result <- rmst2(
        data[[time_col]],
        data[[event_col]],
        data[[group_col]],
        tau = horizon
    )

    list(
        hazard_ratio = list(hr = hr, ci = hr_ci),
        median_survival = med_surv,
        survival_summary = surv_summary,
        rmst = rmst_result$RMST.arm0$rmst,
        rmst_diff = rmst_result$unadjusted.result[1, 1]
    )
}
Summary: Which Metric When
| Audience | Question | Best Metric |
|---|---|---|
| Statisticians | Effect size for Cox model | Hazard Ratio |
| Clinical researchers | Treatment efficacy | HR with median difference |
| Product managers | Impact on retention | Survival at D30, D90 |
| Executives | Business case | RMST difference ("days gained") |
| Finance | ROI calculation | Absolute churn reduction |
Related Methods
- Time-to-Event and Retention Analysis (Pillar) - Full survival framework
- Cox Proportional Hazards - When HR is appropriate
- Kaplan-Meier Curves - Visual survival analysis
- Reporting Templates - Communicating results
Key Takeaway
Hazard ratios measure relative speed of events, not relative probability. HR=0.7 means "churning 30% more slowly," not "30% less likely to churn." For most product decisions, simpler metrics work better: median survival difference ("users stay 20 days longer"), survival at key times ("85% vs 70% at day 30"), or RMST ("users gained 12 extra days on average"). Use HR for technical reports; translate for everyone else.
References
- https://www.ncbi.nlm.nih.gov/pmc/articles/PMC4890774/
- https://www.bmj.com/content/322/7280/226
- https://doi.org/10.1002/sim.7977
- Spruance, S. L., Reid, J. E., Grace, M., & Samore, M. (2004). Hazard ratio in clinical trials. *Antimicrobial Agents and Chemotherapy*, 48(8), 2787-2792.
- Sashegyi, A., & Ferry, D. (2017). On the interpretation of the hazard ratio and communication of survival benefit. *The Oncologist*, 22(4), 484-486.
- Uno, H., Claggett, B., Tian, L., et al. (2014). Moving beyond the hazard ratio in quantifying the between-group difference in survival analysis. *Journal of Clinical Oncology*, 32(22), 2380-2385.
Frequently Asked Questions
What's the difference between hazard ratio and risk ratio?
How do I explain hazard ratio to my PM?
When is the hazard ratio misleading?
Key Takeaway
Hazard ratios measure the relative speed of events, not the relative probability. For stakeholder communication, translate to: (1) median survival time difference, (2) survival percentages at key time points, or (3) restricted mean survival time. These are easier to understand and act upon.