Contents
Accelerated Failure Time Models: When Cox Doesn't Fit
When proportional hazards fail, AFT models offer an interpretable alternative. Learn when to use accelerated failure time models, how to interpret time ratios, and how they compare to Cox regression.
Quick Hits
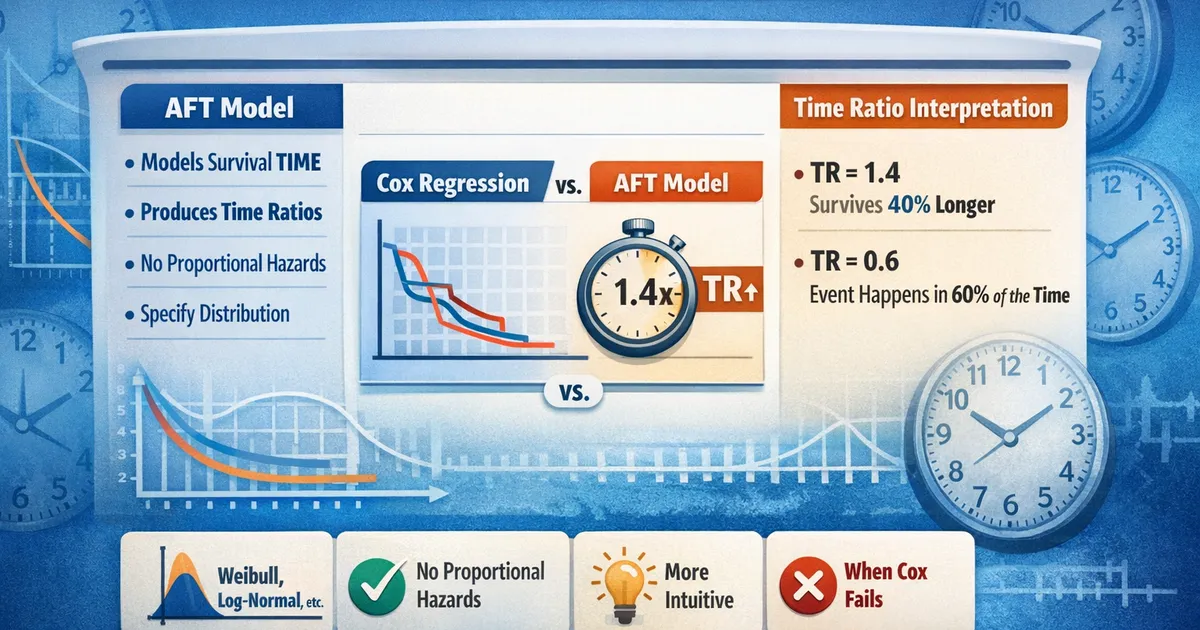
- •AFT models the effect of covariates on survival TIME, not hazard rate
- •Produces time ratios: TR = 1.3 means the group survives 30% longer
- •Does NOT require proportional hazards — works when Cox doesn't
- •Must specify a distribution (Weibull, log-normal, log-logistic)
- •More intuitive interpretation for non-statisticians: 'this slows/speeds the event'
Accelerated Failure Time (AFT) models offer a fundamentally different approach to survival analysis compared to Cox Proportional Hazards. Where Cox models the hazard rate, AFT models survival time directly.
When Cox Doesn't Work
The Cox regression requires proportional hazards: the hazard ratio between groups must be constant over time. When this assumption fails — for example, when a treatment effect wears off or when survival curves cross — Cox estimates become unreliable.
Common signs of non-proportional hazards:
- Schoenfeld residuals show a significant time trend
- Log-log survival plots are not parallel
- The effect makes clinical/product sense only for a limited period (e.g., an onboarding intervention helps early but not late)
How AFT Models Work
Instead of modeling the hazard rate, AFT models assume that covariates accelerate or decelerate the time to the event. The model takes the form:
Where is survival time, are covariates, and follows a specified distribution. Exponentiating the coefficients gives time ratios.
Choosing a Distribution
| Distribution | Hazard Shape | Best For |
|---|---|---|
| Weibull | Monotonically increasing or decreasing | Most general starting point |
| Exponential | Constant | Memoryless processes (rare in practice) |
| Log-Normal | Non-monotonic (rises then falls) | Right-skewed survival times |
| Log-Logistic | Non-monotonic | Treatments with early benefit that fades |
Compare candidate distributions using AIC or BIC. The Weibull model is usually a safe starting point.
AFT vs. Cox: A Practical Comparison
| Feature | Cox PH | AFT |
|---|---|---|
| Assumption | Proportional hazards | Parametric distribution |
| Effect measure | Hazard ratio (HR) | Time ratio (TR) |
| Interpretation | "50% higher risk at any time" | "Takes 50% longer to occur" |
| Baseline hazard | Unspecified | Fully specified |
| Flexibility | Semi-parametric | Parametric |
Example
You are analyzing time from trial start to paid conversion. Cox regression shows Schoenfeld residual trends (non-proportional hazards) because the effect of a promotional offer diminishes after 14 days.
Fitting a Weibull AFT model, you find that users who received the offer have a time ratio of 0.72 — they convert 28% faster on average. This is more useful than a hazard ratio that changes over time.
References
- https://www.ncbi.nlm.nih.gov/pmc/articles/PMC5233524/
- https://lifelines.readthedocs.io/en/latest/Survival%20Regression.html
Frequently Asked Questions
When should I use AFT instead of Cox?
How do I interpret a time ratio?
Which distribution should I choose?
Key Takeaway
Accelerated Failure Time models are the go-to alternative when Cox proportional hazards assumptions fail. They model survival time directly, producing intuitive time ratios that stakeholders understand more easily than hazard ratios. The trade-off is that you must specify a distributional form.