Contents
Kaplan-Meier Estimator
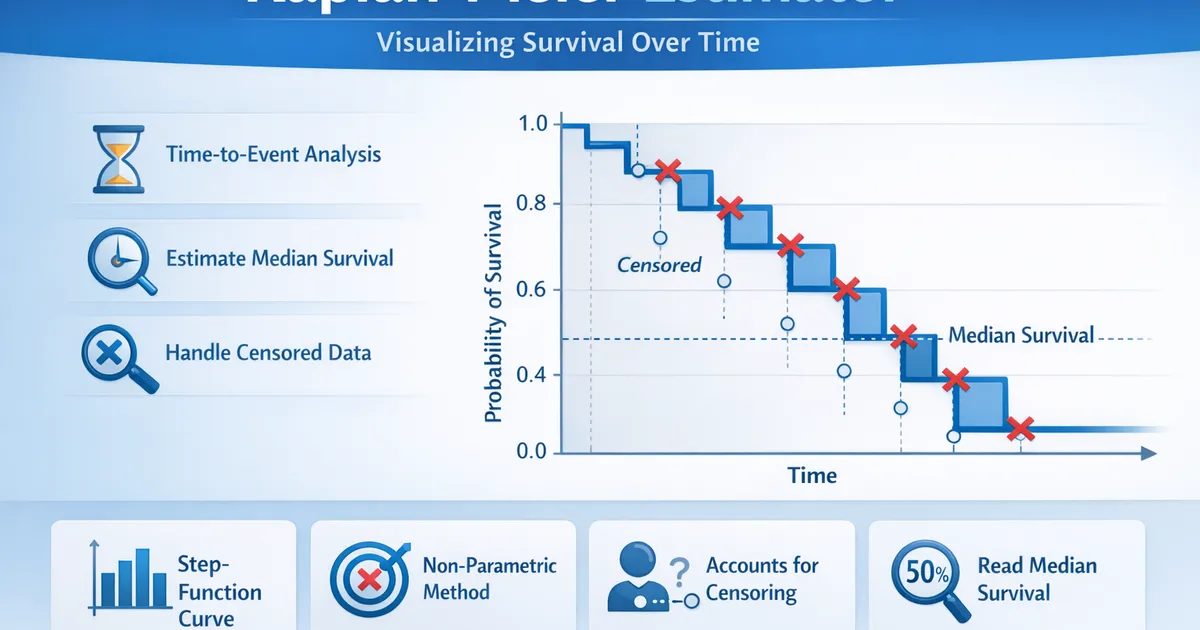
The Kaplan-Meier Estimator constructs a survival curve showing the probability of not experiencing an event over time. Use it to visualize retention, estimate median survival, and handle censored data.
Quick Hits
- •Estimates the probability of surviving (not experiencing the event) past each time point
- •Produces a step-function survival curve that drops at each observed event
- •Correctly handles censored observations: subjects who have not yet had the event
- •Non-parametric: no assumption about the shape of the survival distribution
- •Read median survival where the curve crosses 50% on the y-axis
The StatsTest Flow: Time-to-Event / Survival >> Estimate survival curve
Not sure this is the right statistical method? Use the Choose Your StatsTest workflow to select the right method.
What is the Kaplan-Meier Estimator?
The Kaplan-Meier Estimator (also called the product-limit estimator) is a non-parametric method for estimating the survival function from time-to-event data. It produces a step-function curve that shows the probability of surviving (not experiencing the event) beyond each time point.
The key strength of the Kaplan-Meier estimator is its ability to handle censored observations. In many real-world datasets, not all subjects will have experienced the event by the end of the observation period. Rather than discarding these incomplete observations, the Kaplan-Meier estimator uses all available information to produce an accurate survival estimate.
The Kaplan-Meier Estimator is also called the Kaplan-Meier Curve, KM Estimator, KM Curve, Product-Limit Estimator, or Survival Curve.
Assumptions for the Kaplan-Meier Estimator
Every statistical method has assumptions. Assumptions mean that your data must satisfy certain properties in order for statistical method results to be accurate.
The assumptions for the Kaplan-Meier Estimator include:
- Time-to-Event Outcome
- Non-Informative Censoring
- Well-Defined Event
- Independent Observations
Time-to-Event Outcome
Your outcome must be the time from a clearly defined origin (e.g., signup date, treatment start, deployment) to a well-defined event (e.g., churn, conversion, failure).
If your outcome is measured at a single time point rather than as a duration, standard descriptive statistics or hypothesis tests (like a Single Sample T-Test) are more appropriate.
Non-Informative Censoring
Censored subjects (those who have not yet experienced the event) must have the same future risk as those still being followed at the same time point. If subjects drop out because they are about to experience the event, the survival estimate will be biased upward.
Well-Defined Event
The event of interest must be clearly defined and observable. Each subject either experiences the event at a known time or is censored at a known time. Ambiguous endpoints lead to misclassification.
Independent Observations
Each subject must contribute one independent observation. If the same subject can appear multiple times, standard Kaplan-Meier is inappropriate and you need methods that account for recurrent events or clustering.
When to use the Kaplan-Meier Estimator?
You should use the Kaplan-Meier Estimator in the following scenario:
- You want to estimate how long it takes for an event to occur
- Your outcome is time until an event (churn, conversion, failure, recovery)
- Some subjects have not yet experienced the event (censored data)
- You want to visualize the survival curve or report survival probabilities at specific time points
Estimation, Not Comparison
The Kaplan-Meier estimator describes the survival experience of a group. If you want to compare two or more groups, first construct separate Kaplan-Meier curves and then use the Log-Rank Test to test for differences.
Censored Data
The primary advantage of the Kaplan-Meier estimator is its handling of censored observations. If you have complete data (every subject experienced the event), you can use simple percentages or averages, but the Kaplan-Meier estimator still works correctly.
If you want to model the effect of covariates on survival time, use Cox Proportional Hazards regression instead.
Kaplan-Meier Estimator Example
Population: All users who signed up for a SaaS product in January 2026. Event of interest: Canceling their subscription (churn). Observation window: 90 days from signup.
Some users cancel within the first week, others within the first month, and some are still subscribed at the end of the observation window. These still-subscribed users are censored: we know they survived at least 90 days, but we do not know when (or if) they will eventually cancel.
The Kaplan-Meier estimator uses all of this information to produce a survival curve. At each time point where a cancellation occurs, the curve steps down. Censored observations do not cause a step but reduce the number of subjects at risk. Reading the curve at 30 days gives D30 retention; reading it at 60 days gives D60 retention.
The resulting curve is intuitive: it starts at 100% and decreases over time. Where it crosses 50% is the median survival time, meaning half the cohort has churned by that point. Confidence intervals widen at later time points because fewer subjects remain.
References
- https://www.ncbi.nlm.nih.gov/pmc/articles/PMC3059453/
- https://www.bmj.com/content/317/7172/1572
Frequently Asked Questions
What is the difference between Kaplan-Meier and a simple percentage?
Can I compare two Kaplan-Meier curves statistically?
How do I interpret confidence intervals on a Kaplan-Meier curve?
Key Takeaway
The Kaplan-Meier estimator is the standard method for estimating a survival curve from time-to-event data. It correctly handles subjects who have not yet experienced the event (censoring), produces intuitive step-function plots, and serves as the foundation for most survival analyses.