Contents
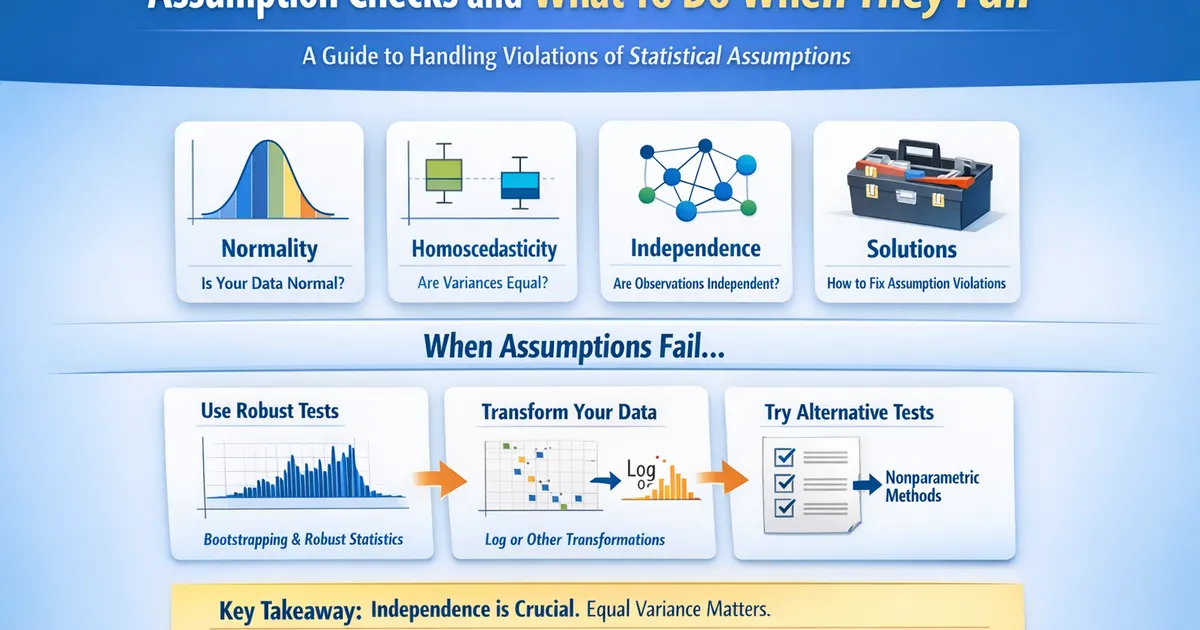
Assumption Checks and What To Do When They Fail
A comprehensive guide to statistical assumptions in hypothesis testing. Learn which assumptions matter most, how to diagnose violations, and what to do when your data doesn't fit the textbook requirements.
Quick Hits
- •Independence is the most critical assumption—violations can't be fixed with robust methods
- •Normality matters least with large samples due to the Central Limit Theorem
- •Equal variances matter more than normality for t-tests and ANOVA
- •Most assumption tests are underpowered when it matters and overpowered when it doesn't
- •When in doubt, use robust methods or bootstrap—they rarely hurt and often help
TL;DR
Every statistical test has assumptions, but not all assumptions matter equally. Independence is critical—violations require structural solutions. Equal variance matters for group comparisons, especially with unequal sample sizes. Normality matters least, especially for large samples. When assumptions fail, don't panic: you have robust alternatives, transformations, and different tests. The key is matching the severity of your response to the severity of the violation.
The Assumption Hierarchy
Not all assumptions are created equal. Here's the hierarchy of concern:
Critical: Independence
What it means: Observations don't influence each other.
Why it's critical: Violations fundamentally change what your test estimates. A "sample of 1000" might effectively be a sample of 10 if observations are clustered.
Can you fix it?: Not with standard robust methods. Requires structural solutions (mixed models, clustered standard errors, or different experimental design).
Important: Homogeneity of Variance
What it means: Groups have similar spread.
Why it matters: Affects standard error estimation and inference, especially with unequal sample sizes.
Can you fix it?: Yes—Welch's t-test, Games-Howell post-hoc, robust standard errors.
Least Critical: Normality
What it means: Data (or residuals) follow a bell curve.
Why it matters less: Central Limit Theorem means sampling distributions of means become normal with sufficient sample size.
Can you fix it?: Yes—bootstrap, rank-based tests, or often just ignore with large samples.
import numpy as np
from scipy import stats
import matplotlib.pyplot as plt

def demonstrate_clt():
    """
    Show how the Central Limit Theorem makes normality less critical.
    """
    np.random.seed(42)

    # Highly non-normal distribution (exponential)
    population = stats.expon(scale=10)

    sample_sizes = [5, 15, 30, 100]
    n_simulations = 10000

    fig, axes = plt.subplots(2, 4, figsize=(16, 8))

    for i, n in enumerate(sample_sizes):
        # Simulate sample means
        sample_means = [population.rvs(n).mean() for _ in range(n_simulations)]

        # Top row: distribution of sample means
        axes[0, i].hist(sample_means, bins=50, density=True, alpha=0.7)
        axes[0, i].set_title(f'n = {n}')
        axes[0, i].set_xlabel('Sample Mean')

        # Bottom row: Q-Q plot
        stats.probplot(sample_means, dist="norm", plot=axes[1, i])
        axes[1, i].set_title(f'Q-Q Plot (n = {n})')

    axes[0, 0].set_ylabel('Density')
    plt.suptitle('CLT: Sample means become normal as n increases\n(from highly skewed exponential population)')
    plt.tight_layout()
    return fig


# Type I error rates under non-normality
def simulate_type1_nonnormal(sample_sizes, n_sims=10000):
    """
    Show that t-test maintains Type I error even with non-normal data.
    """
    results = {}

    for n in sample_sizes:
        rejections = 0
        for _ in range(n_sims):
            # Two samples from same exponential distribution (null true)
            group1 = stats.expon(scale=10).rvs(n)
            group2 = stats.expon(scale=10).rvs(n)

            _, p = stats.ttest_ind(group1, group2)
            if p < 0.05:
                rejections += 1

        results[n] = rejections / n_sims

    return results

type1_rates = simulate_type1_nonnormal([10, 20, 30, 50, 100])
print("Type I error rates with highly skewed (exponential) data:")
for n, rate in type1_rates.items():
    print(f"  n = {n}: {rate:.3f} (nominal: 0.050)")
Independence: The Silent Killer
Independence violations are the most dangerous because they're often invisible and can't be fixed with standard robust methods.
Common Independence Violations
| Violation | Example | Problem | Solution |
|---|---|---|---|
| Repeated measures | Multiple purchases per user | Users are correlated with themselves | Mixed models, or aggregate to user level |
| Clustering | Users in same company/classroom/region | Within-cluster similarity inflates sample size | Clustered standard errors, mixed models |
| Time series | Daily metrics, autocorrelated errors | Today predicts tomorrow | Time series models, Newey-West errors |
| Network effects | Users who interact with each other | Treatment spills over between users | Network randomization, cluster by network |
| Device/session | Multiple sessions per user | Sessions from same user aren't independent | User-level randomization and analysis |
Detecting Independence Violations
def check_independence(data, unit_col, observation_col):
    """
    Diagnose potential independence violations.
    """
    # Count observations per unit
    obs_per_unit = data.groupby(unit_col)[observation_col].count()

    results = {
        'total_observations': len(data),
        'unique_units': data[unit_col].nunique(),
        'effective_sample_ratio': data[unit_col].nunique() / len(data),
        'obs_per_unit_mean': obs_per_unit.mean(),
        'obs_per_unit_max': obs_per_unit.max(),
        'units_with_multiple': (obs_per_unit > 1).sum()
    }

    # Diagnosis
    if results['effective_sample_ratio'] < 0.5:
        results['warning'] = (
            f"High clustering: {results['total_observations']} observations "
            f"from only {results['unique_units']} units. "
            f"Effective sample size may be much smaller than n={results['total_observations']}."
        )

    return results


import pandas as pd

# Example: e-commerce data
np.random.seed(42)
n_users = 100
orders = []
for user_id in range(n_users):
    n_orders = np.random.poisson(3) + 1  # 1-7 orders per user
    for _ in range(n_orders):
        orders.append({
            'user_id': user_id,
            'order_value': np.random.exponential(50)
        })

order_df = pd.DataFrame(orders)
independence_check = check_independence(order_df, 'user_id', 'order_value')
print(f"Total orders: {independence_check['total_observations']}")
print(f"Unique users: {independence_check['unique_units']}")
print(f"Effective sample ratio: {independence_check['effective_sample_ratio']:.2f}")
print(f"Mean orders per user: {independence_check['obs_per_unit_mean']:.1f}")
What Independence Violations Do to Your Analysis
def demonstrate_clustering_effect(n_sims=5000):
    """
    Show how clustering inflates Type I error.
    """
    np.random.seed(42)

    # Scenario: 10 clusters of 10 observations each
    n_clusters = 10
    cluster_size = 10

    rejections_naive = 0
    rejections_correct = 0

    for _ in range(n_sims):
        # Generate clustered data (null is true - no group difference)
        # Treatment and control each get some clusters
        data = []
        for cluster in range(n_clusters * 2):
            group = 'treatment' if cluster >= n_clusters else 'control'
            cluster_effect = np.random.normal(0, 5)  # Cluster-level variation

            for _ in range(cluster_size):
                value = cluster_effect + np.random.normal(0, 1)  # Within-cluster
                data.append({'group': group, 'value': value, 'cluster': cluster})

        df = pd.DataFrame(data)

        # Naive analysis (ignores clustering)
        control = df[df['group'] == 'control']['value']
        treatment = df[df['group'] == 'treatment']['value']
        _, p_naive = stats.ttest_ind(control, treatment)
        if p_naive < 0.05:
            rejections_naive += 1

        # Correct analysis (cluster means)
        cluster_means = df.groupby(['group', 'cluster'])['value'].mean().reset_index()
        control_means = cluster_means[cluster_means['group'] == 'control']['value']
        treatment_means = cluster_means[cluster_means['group'] == 'treatment']['value']
        _, p_correct = stats.ttest_ind(control_means, treatment_means)
        if p_correct < 0.05:
            rejections_correct += 1

    print("Type I Error Rates with Clustered Data:")
    print(f"  Naive (ignores clustering): {rejections_naive / n_sims:.3f}")
    print(f"  Correct (uses cluster means): {rejections_correct / n_sims:.3f}")
    print(f"  Nominal rate: 0.050")


demonstrate_clustering_effect()
Equal Variance (Homoscedasticity)
Why It Matters
When groups have unequal variances, the pooled variance estimate is wrong, affecting standard errors and p-values.
def demonstrate_variance_problem():
    """
    Show how unequal variance affects Type I error.
    """
    np.random.seed(42)
    n_sims = 10000

    scenarios = [
        ('Equal var, equal n', [30, 30], [1, 1]),
        ('Unequal var, equal n', [30, 30], [1, 4]),
        ('Larger var in smaller group', [15, 45], [4, 1]),  # Inflates Type I
        ('Larger var in larger group', [45, 15], [4, 1]),   # Conservative
    ]

    results = {}
    for name, ns, vars_ in scenarios:
        rejections_standard = 0
        rejections_welch = 0

        for _ in range(n_sims):
            g1 = np.random.normal(0, np.sqrt(vars_[0]), ns[0])
            g2 = np.random.normal(0, np.sqrt(vars_[1]), ns[1])

            _, p_standard = stats.ttest_ind(g1, g2, equal_var=True)
            _, p_welch = stats.ttest_ind(g1, g2, equal_var=False)

            if p_standard < 0.05:
                rejections_standard += 1
            if p_welch < 0.05:
                rejections_welch += 1

        results[name] = {
            'standard': rejections_standard / n_sims,
            'welch': rejections_welch / n_sims
        }

    print("Type I Error Rates (null true, alpha=0.05):")
    print(f"{'Scenario':<40} {'Standard':>10} {'Welch':>10}")
    print("-" * 60)
    for name, rates in results.items():
        print(f"{name:<40} {rates['standard']:>10.3f} {rates['welch']:>10.3f}")


demonstrate_variance_problem()
Testing for Equal Variance
from scipy.stats import levene, bartlett

def test_homogeneity(*groups):
    """
    Test for equal variances across groups.
    """
    # Levene's test (robust to non-normality)
    levene_stat, levene_p = levene(*groups, center='median')

    # Bartlett's test (assumes normality)
    bartlett_stat, bartlett_p = bartlett(*groups)

    # Variance ratio (rule of thumb)
    variances = [np.var(g, ddof=1) for g in groups]
    var_ratio = max(variances) / min(variances)

    return {
        'levene_p': levene_p,
        'bartlett_p': bartlett_p,
        'variance_ratio': var_ratio,
        'variances': variances,
        'recommendation': 'Use Welch' if var_ratio > 2 else 'Standard OK'
    }


# Example
g1 = np.random.normal(50, 5, 30)   # SD = 5
g2 = np.random.normal(50, 15, 30)  # SD = 15

result = test_homogeneity(g1, g2)
print(f"Levene's test p-value: {result['levene_p']:.4f}")
print(f"Variance ratio: {result['variance_ratio']:.1f}")
print(f"Recommendation: {result['recommendation']}")
Solutions for Unequal Variance
| Problem | Solution |
|---|---|
| Two groups | Welch's t-test |
| Multiple groups | Welch's ANOVA |
| Post-hoc comparisons | Games-Howell |
| Regression | Robust standard errors |
from scipy.stats import alexandergovern

def robust_group_comparison(*groups, group_names=None):
    """
    Compare groups without assuming equal variance.
    """
    if group_names is None:
        group_names = [f'Group {i+1}' for i in range(len(groups))]

    # Two groups: Welch's t-test
    if len(groups) == 2:
        stat, p = stats.ttest_ind(groups[0], groups[1], equal_var=False)
        test_name = "Welch's t-test"
    # More groups: Welch's ANOVA
    else:
        result = alexandergovern(*groups)
        stat, p = result.statistic, result.pvalue
        test_name = "Welch's ANOVA"

    return {
        'test': test_name,
        'statistic': stat,
        'p_value': p,
        'means': {name: np.mean(g) for name, g in zip(group_names, groups)},
        'sds': {name: np.std(g, ddof=1) for name, g in zip(group_names, groups)}
    }
Normality
The Most Overrated Assumption
Normality is the assumption analysts worry about most but matters least.
1. Central limit theorem. The sampling distribution of means approaches normal regardless of the population distribution, given sufficient n.
2. Robustness of the t-test. The two-sample t-test is remarkably robust to non-normality, especially with equal group sizes.
3. Normality tests are problematic. With small n, they lack the power to detect real violations. With large n, they reject trivial deviations that don't affect results.
4. What actually matters:
- Severe outliers (affect the mean)
- Extreme skewness with small n
- Heavy tails (affect variance estimates)
When Normality Actually Matters
| Situation | Why it matters | Solution |
|---|---|---|
| Small samples (n < 15) | CLT hasn't kicked in yet | Use exact tests or bootstrap |
| Prediction intervals | Individual predictions need a distribution assumption | Use quantile regression or bootstrap |
| Variance/dispersion tests | These are sensitive to distributional form | Use robust alternatives (Levene with median) |
| Very heavy tails | Sample mean may not converge quickly | Trim, Winsorize, or use median-based methods |
| Maximum likelihood estimation | Efficiency depends on correct distribution | Use robust or quasi-maximum likelihood |
Assessing Normality (When You Need To)
from scipy.stats import shapiro, normaltest, probplot

def assess_normality(data, alpha=0.05):
    """
    Comprehensive normality assessment.
    Emphasizes visual diagnostics over tests.
    """
    n = len(data)

    results = {
        'n': n,
        'mean': np.mean(data),
        'median': np.median(data),
        'std': np.std(data, ddof=1),
        'skewness': stats.skew(data),
        'kurtosis': stats.kurtosis(data)  # Excess kurtosis
    }

    # Tests (with caveats)
    if n >= 3:
        if n <= 5000:
            shapiro_stat, shapiro_p = shapiro(data)
            results['shapiro_p'] = shapiro_p

        if n >= 20:
            dagostino_stat, dagostino_p = normaltest(data)
            results['dagostino_p'] = dagostino_p

    # Practical assessment
    results['assessment'] = []

    if abs(results['skewness']) > 2:
        results['assessment'].append('Severely skewed')
    elif abs(results['skewness']) > 1:
        results['assessment'].append('Moderately skewed')

    if results['kurtosis'] > 7:
        results['assessment'].append('Very heavy tails')
    elif results['kurtosis'] > 3:
        results['assessment'].append('Somewhat heavy tails')
    elif results['kurtosis'] < -1:
        results['assessment'].append('Light tails (platykurtic)')

    # CLT guidance
    if n >= 100:
        results['clt_guidance'] = 'Large sample—CLT applies, normality usually fine'
    elif n >= 30:
        if abs(results['skewness']) < 1:
            results['clt_guidance'] = 'Moderate sample, mild skew—probably OK'
        else:
            results['clt_guidance'] = 'Moderate sample, notable skew—consider robust methods'
    else:
        results['clt_guidance'] = 'Small sample—verify normality or use alternatives'

    return results


def plot_normality_diagnostics(data, title=''):
    """
    Visual diagnostics for normality.
    """
    fig, axes = plt.subplots(1, 3, figsize=(15, 4))

    # Histogram with normal overlay
    axes[0].hist(data, bins='auto', density=True, alpha=0.7)
    x = np.linspace(min(data), max(data), 100)
    axes[0].plot(x, stats.norm.pdf(x, np.mean(data), np.std(data)), 'r-', lw=2)
    axes[0].set_title('Histogram with Normal Overlay')
    axes[0].set_xlabel('Value')
    axes[0].set_ylabel('Density')

    # Q-Q plot
    probplot(data, dist="norm", plot=axes[1])
    axes[1].set_title('Q-Q Plot')

    # Box plot
    axes[2].boxplot(data, vert=True)
    axes[2].set_title('Box Plot')
    axes[2].set_ylabel('Value')

    if title:
        fig.suptitle(title, fontsize=14)

    plt.tight_layout()
    return fig


# Example with different distributions
np.random.seed(42)
normal_data = np.random.normal(100, 15, 50)
skewed_data = np.random.exponential(20, 50) + 50
heavy_tailed = np.random.standard_t(3, 50) * 15 + 100

for name, data in [('Normal', normal_data),
                   ('Skewed', skewed_data),
                   ('Heavy-tailed', heavy_tailed)]:
    result = assess_normality(data)
    print(f"\n{name} data (n={result['n']}):")
    print(f"  Skewness: {result['skewness']:.2f}")
    print(f"  Kurtosis: {result['kurtosis']:.2f}")
    print(f"  Assessment: {', '.join(result['assessment']) or 'Reasonably normal'}")
    print(f"  CLT guidance: {result['clt_guidance']}")
The Decision Framework
Step 1: Are observations independent?
- Multiple observations per unit?
- Clustering structure?
- Time series/autocorrelation?
- Network effects?
- If violated: use mixed models, clustered SEs, or aggregate data
Step 2: Are there extreme outliers?
- Values > 3 SDs from mean?
- Points clearly separated from bulk?
- Data entry errors?
- If violated: investigate the source; consider robust methods or trimming
Step 3: Are variances approximately equal?
- Variance ratio > 2-3?
- Levene test significant?
- Visual spread differs?
- If violated: use Welch variants or robust standard errors
Step 4: Is normality adequate?
- Q-Q plot reasonably linear?
- Skewness < 1-2?
- No severe outliers?
- Sample size adequate for CLT?
- If violated: consider bootstrap, rank tests, or transformations
def quick_diagnostic_report(data, groups=None, group_labels=None):
    """
    Generate a quick diagnostic report for assumption checking.
    """
    report = []
    report.append("=" * 60)
    report.append("QUICK DIAGNOSTIC REPORT")
    report.append("=" * 60)

    if groups is None:
        # Single sample
        n = len(data)
        report.append(f"\nSample size: {n}")
        report.append(f"Mean: {np.mean(data):.3f}")
        report.append(f"SD: {np.std(data, ddof=1):.3f}")
        report.append(f"Skewness: {stats.skew(data):.3f}")
        report.append(f"Kurtosis: {stats.kurtosis(data):.3f}")

        # Outlier check
        z_scores = np.abs(stats.zscore(data))
        n_outliers = np.sum(z_scores > 3)
        report.append(f"Potential outliers (|z| > 3): {n_outliers}")

    else:
        # Multiple groups
        if group_labels is None:
            group_labels = [f'Group {i+1}' for i in range(len(groups))]

        report.append("\nGROUP SUMMARY:")
        report.append("-" * 40)

        for label, g in zip(group_labels, groups):
            report.append(f"\n{label}:")
            report.append(f"  n = {len(g)}")
            report.append(f"  Mean = {np.mean(g):.3f}")
            report.append(f"  SD = {np.std(g, ddof=1):.3f}")
            report.append(f"  Skewness = {stats.skew(g):.3f}")

        # Variance check
        variances = [np.var(g, ddof=1) for g in groups]
        var_ratio = max(variances) / min(variances)
        levene_stat, levene_p = levene(*groups, center='median')

        report.append("\nVARIANCE CHECK:")
        report.append("-" * 40)
        report.append(f"Variance ratio: {var_ratio:.2f}")
        report.append(f"Levene's test p: {levene_p:.4f}")

        if var_ratio > 3:
            report.append("⚠️  Substantial variance inequality—use Welch methods")
        elif var_ratio > 2:
            report.append("⚠️  Moderate variance inequality—consider Welch methods")
        else:
            report.append("✓  Variances reasonably similar")

        # Sample size check
        ns = [len(g) for g in groups]
        n_ratio = max(ns) / min(ns)

        report.append("\nSAMPLE SIZE CHECK:")
        report.append("-" * 40)
        report.append(f"Sample sizes: {ns}")
        report.append(f"Size ratio: {n_ratio:.2f}")

        if n_ratio > 2 and var_ratio > 2:
            report.append("⚠️  Unequal n with unequal variance—definitely use Welch")

    report.append("\n" + "=" * 60)

    return "\n".join(report)


# Example
np.random.seed(42)
group_a = np.random.normal(50, 5, 30)
group_b = np.random.normal(55, 15, 20)  # Different mean, variance, and n

print(quick_diagnostic_report(None, [group_a, group_b], ['Control', 'Treatment']))
What To Do When Assumptions Fail
Decision Tree
Is independence violated?
├── YES → Structural solution needed
│         - Mixed models for repeated measures
│         - Clustered standard errors
│         - Aggregate to independent units
│
└── NO → Continue

         Are variances very unequal (ratio > 3)?
         ├── YES → Use robust variance methods
         │         - Welch's t-test / ANOVA
         │         - Games-Howell post-hoc
         │         - Robust standard errors
         │
         └── NO → Continue

                  Are there severe outliers?
                  ├── YES → Investigate and decide
                  │         - If errors: fix or remove
                  │         - If real: use robust methods
                  │         - Trim, Winsorize, or rank-based
                  │
                  └── NO → Continue

                           Is distribution very non-normal?
                           ├── Small n + severe skew →
                           │   Bootstrap or rank-based tests
                           │
                           └── Large n OR mild skew →
                               Standard methods usually OK
Method Selection Guide
def recommend_method(n_groups, n_per_group, variance_ratio,
                     skewness, has_outliers, independence_ok):
    """
    Recommend analysis method based on data characteristics.
    """
    if not independence_ok:
        return {
            'method': 'Address independence first',
            'options': [
                'Mixed models (for repeated measures)',
                'Clustered standard errors',
                'Aggregate to independent unit level',
                'Consult statistician'
            ],
            'severity': 'CRITICAL'
        }

    # Two groups
    if n_groups == 2:
        if variance_ratio > 2 or has_outliers:
            return {
                'method': "Welch's t-test",
                'backup': 'Mann-Whitney U (if outliers severe)',
                'severity': 'MODERATE'
            }
        elif skewness > 2 and n_per_group < 30:
            return {
                'method': 'Mann-Whitney U or bootstrap',
                'severity': 'MODERATE'
            }
        else:
            return {
                'method': "Standard or Welch's t-test",
                'note': "Welch's is safe default",
                'severity': 'LOW'
            }

    # Multiple groups
    else:
        if variance_ratio > 2:
            return {
                'method': "Welch's ANOVA",
                'posthoc': 'Games-Howell',
                'severity': 'MODERATE'
            }
        elif skewness > 2 and n_per_group < 30:
            return {
                'method': 'Kruskal-Wallis',
                'posthoc': "Dunn's test",
                'severity': 'MODERATE'
            }
        else:
            return {
                'method': 'Standard ANOVA or Welch\'s ANOVA',
                'posthoc': "Tukey's HSD or Games-Howell",
                'severity': 'LOW'
            }
Common Mistakes
Mistake 1: Testing Assumptions on Small Samples
Small samples lack power to detect meaningful violations:
def assumption_test_power_problem():
    """
    Show that assumption tests are problematic.
    """
    np.random.seed(42)
    n_sims = 1000

    # Population is clearly non-normal (exponential)
    results = []

    for n in [10, 20, 50, 100, 500]:
        rejections = 0
        for _ in range(n_sims):
            sample = np.random.exponential(10, n)
            _, p = shapiro(sample) if n <= 5000 else normaltest(sample)
            if p < 0.05:
                rejections += 1
        results.append({'n': n, 'power': rejections / n_sims})

    print("Shapiro-Wilk power to detect exponential distribution:")
    print("(Population is clearly non-normal)")
    for r in results:
        print(f"  n = {r['n']:3d}: {r['power']:.1%} rejection rate")


assumption_test_power_problem()
Mistake 2: Transforming Without Understanding
- Changing the hypothesis: Log transform tests geometric means, not arithmetic. Ask: is this what I want to estimate?
- Zeros: log(0) is undefined. Adding a small constant is arbitrary; consider two-part models instead.
- Negative values: Can't log negative numbers. Shift data or use a different transformation.
- Back-transformation: Mean of log-transformed data ≠ log of mean. Report in original scale with correct back-transformation.
Mistake 3: Ignoring Practical Significance of Violations
| Assumption | Trivial | Moderate | Serious |
|---|---|---|---|
| Normality | Slight skew with n > 30 | Moderate skew with n > 50 | Severe skew with n < 30, heavy outliers |
| Equal variance | Ratio < 2 with equal n | Ratio 2-4 with similar n | Ratio > 4, especially with unequal n |
| Independence | Never — always address | Never — always address | Any violation is serious |
Complete Diagnostic Workflow
def full_diagnostic_workflow(groups, group_names, alpha=0.05):
    """
    Complete assumption checking and method recommendation.
    """
    print("=" * 70)
    print("COMPREHENSIVE ASSUMPTION CHECK")
    print("=" * 70)

    # 1. Basic descriptives
    print("\n1. DESCRIPTIVE STATISTICS")
    print("-" * 50)
    for name, g in zip(group_names, groups):
        print(f"\n{name} (n={len(g)}):")
        print(f"  Mean: {np.mean(g):.3f}")
        print(f"  Median: {np.median(g):.3f}")
        print(f"  SD: {np.std(g, ddof=1):.3f}")
        print(f"  Skewness: {stats.skew(g):.3f}")
        print(f"  Kurtosis: {stats.kurtosis(g):.3f}")

        # Outliers
        z = np.abs(stats.zscore(g))
        outliers = np.sum(z > 3)
        if outliers > 0:
            print(f"  ⚠️  Potential outliers: {outliers}")

    # 2. Variance homogeneity
    print("\n\n2. VARIANCE HOMOGENEITY")
    print("-" * 50)
    variances = [np.var(g, ddof=1) for g in groups]
    var_ratio = max(variances) / min(variances)
    lev_stat, lev_p = levene(*groups, center='median')

    print(f"Variances: {[f'{v:.2f}' for v in variances]}")
    print(f"Variance ratio: {var_ratio:.2f}")
    print(f"Levene's test: p = {lev_p:.4f}")

    if var_ratio > 3:
        print("❌ FAIL: Substantial variance inequality")
        variance_ok = False
    elif var_ratio > 2:
        print("⚠️  WARNING: Moderate variance inequality")
        variance_ok = False
    else:
        print("✓ PASS: Variances reasonably similar")
        variance_ok = True

    # 3. Normality (per group)
    print("\n\n3. NORMALITY CHECK")
    print("-" * 50)
    normality_ok = True

    for name, g in zip(group_names, groups):
        n = len(g)
        skew = stats.skew(g)
        kurt = stats.kurtosis(g)

        issues = []
        if abs(skew) > 2:
            issues.append(f"severe skew ({skew:.2f})")
        elif abs(skew) > 1:
            issues.append(f"moderate skew ({skew:.2f})")

        if kurt > 7:
            issues.append(f"very heavy tails (kurtosis={kurt:.2f})")

        if n < 30 and issues:
            print(f"\n{name}: ⚠️  Small n with {', '.join(issues)}")
            normality_ok = False
        elif issues:
            print(f"\n{name}: Note {', '.join(issues)} but n={n} (CLT helps)")
        else:
            print(f"\n{name}: ✓ Reasonably normal")

    # 4. Recommendation
    print("\n\n4. RECOMMENDATION")
    print("-" * 50)

    if len(groups) == 2:
        if not variance_ok:
            print("➤ Use Welch's t-test (handles unequal variance)")
        elif not normality_ok:
            print("➤ Consider Mann-Whitney U or bootstrap")
        else:
            print("➤ Standard t-test OK, but Welch's is safe default")
    else:
        if not variance_ok:
            print("➤ Use Welch's ANOVA with Games-Howell post-hoc")
        elif not normality_ok:
            print("➤ Consider Kruskal-Wallis with Dunn's test")
        else:
            print("➤ Standard ANOVA OK, but Welch's is safe default")

    # 5. Run recommended analysis
    print("\n\n5. RESULTS")
    print("-" * 50)

    if len(groups) == 2:
        t_stat, p_welch = stats.ttest_ind(groups[0], groups[1], equal_var=False)
        print(f"Welch's t-test: t = {t_stat:.3f}, p = {p_welch:.4f}")

        # Effect size
        pooled_std = np.sqrt(((len(groups[0])-1)*np.var(groups[0], ddof=1) +
                             (len(groups[1])-1)*np.var(groups[1], ddof=1)) /
                            (len(groups[0]) + len(groups[1]) - 2))
        cohens_d = (np.mean(groups[0]) - np.mean(groups[1])) / pooled_std
        print(f"Cohen's d: {cohens_d:.3f}")
    else:
        result = alexandergovern(*groups)
        print(f"Welch's ANOVA: stat = {result.statistic:.3f}, p = {result.pvalue:.4f}")

    print("\n" + "=" * 70)


# Example
np.random.seed(42)
control = np.random.normal(50, 5, 40)
treatment_a = np.random.exponential(8, 25) + 48  # Skewed, different variance
treatment_b = np.random.normal(55, 12, 35)

full_diagnostic_workflow(
    [control, treatment_a, treatment_b],
    ['Control', 'Treatment A', 'Treatment B']
)
R Implementation
# Complete assumption checking in R

check_assumptions <- function(data, value_col, group_col) {
  # Load required packages
  library(car)
  library(moments)

  groups <- split(data[[value_col]], data[[group_col]])

  cat("ASSUMPTION CHECKS\n")
  cat(rep("=", 50), "\n\n")

  # 1. Descriptives
  cat("1. DESCRIPTIVES\n")
  cat(rep("-", 30), "\n")
  for (name in names(groups)) {
    g <- groups[[name]]
    cat(sprintf("\n%s (n=%d):\n", name, length(g)))
    cat(sprintf("  Mean: %.3f\n", mean(g)))
    cat(sprintf("  SD: %.3f\n", sd(g)))
    cat(sprintf("  Skewness: %.3f\n", skewness(g)))
  }

  # 2. Variance homogeneity
  cat("\n\n2. VARIANCE HOMOGENEITY\n")
  cat(rep("-", 30), "\n")
  levene_result <- leveneTest(data[[value_col]] ~ data[[group_col]],
                               center = median)
  print(levene_result)

  # 3. Normality by group
  cat("\n3. NORMALITY (Shapiro-Wilk by group)\n")
  cat(rep("-", 30), "\n")
  for (name in names(groups)) {
    g <- groups[[name]]
    if (length(g) >= 3 && length(g) <= 5000) {
      sw <- shapiro.test(g)
      cat(sprintf("%s: W = %.4f, p = %.4f\n", name, sw$statistic, sw$p.value))
    }
  }

  # 4. Run both standard and Welch
  cat("\n4. ANALYSIS COMPARISON\n")
  cat(rep("-", 30), "\n")

  if (length(groups) == 2) {
    cat("\nStandard t-test:\n")
    print(t.test(data[[value_col]] ~ data[[group_col]], var.equal = TRUE))

    cat("\nWelch's t-test:\n")
    print(t.test(data[[value_col]] ~ data[[group_col]], var.equal = FALSE))
  } else {
    cat("\nStandard ANOVA:\n")
    print(summary(aov(data[[value_col]] ~ data[[group_col]])))

    cat("\nWelch's ANOVA:\n")
    print(oneway.test(data[[value_col]] ~ data[[group_col]], var.equal = FALSE))
  }
}

# Example usage
# df <- data.frame(
#   value = c(rnorm(30, 50, 5), rnorm(30, 55, 15)),
#   group = rep(c("Control", "Treatment"), each = 30)
# )
# check_assumptions(df, "value", "group")
Related Articles
Supporting Articles in This Cluster
- Normality Tests Are Overrated — Why visual diagnostics beat formal tests
- Equal Variance: When It Matters — Deep dive on variance assumptions
- Independence: The Silent Killer — Detecting and handling non-independence
- Transformations Guide — When transformations help vs. mislead
- Robust Statistics Toolbox — Alternatives that don't need assumptions
- Missing Data Guide — Handling incomplete data
- Multiple Comparisons — Controlling false positives
- Pre-Analysis Checklist — What to check before analyzing
Related Pillar Articles
- Picking the Right Test for Two Groups — Choosing methods for two-group comparisons
- Comparing More Than Two Groups — Multi-group comparison methods
Key Takeaway
Statistical assumptions exist for good reasons, but their importance varies dramatically. Independence is critical and must be addressed structurally—no robust method saves you from violated independence. Equal variance matters, especially with unequal sample sizes, but is easily handled with Welch variants. Normality matters least due to the Central Limit Theorem. When in doubt, use robust methods: they perform almost as well when assumptions hold and much better when they don't.
References
- https://www.jstor.org/stable/2685122
- https://psycnet.apa.org/record/1996-04499-005
- https://www.jstor.org/stable/2529310
- Lix, L. M., Keselman, J. C., & Keselman, H. J. (1996). Consequences of assumption violations revisited: A quantitative review of alternatives to the one-way analysis of variance F test. *Review of Educational Research*, 66(4), 579-619.
- Zimmerman, D. W. (2004). A note on preliminary tests of equality of variances. *British Journal of Mathematical and Statistical Psychology*, 57(1), 173-181.
- Rasch, D., Kubinger, K. D., & Moder, K. (2011). The two-sample t test: pre-testing its assumptions does not pay off. *Statistical Papers*, 52(1), 219-231.
- Wilcox, R. R. (2017). *Introduction to Robust Estimation and Hypothesis Testing* (4th ed.). Academic Press.
Frequently Asked Questions
Which assumption is most important?
Should I run normality tests before every analysis?
What sample size makes normality irrelevant?
Can I transform data to fix assumption violations?
Key Takeaway
Statistical assumptions exist for good reasons, but their importance varies dramatically. Independence is critical and must be addressed structurally. Equal variance matters more than normality. Normality matters least for large samples. When assumptions fail, you have options: robust methods, transformations, or different tests entirely. The key is knowing which violations matter for your specific analysis.