Contents
Pre-Analysis Checklist: Green, Yellow, and Red Flags for Analysts
A practical pre-flight checklist before running statistical analyses. Covers data quality, assumption checks, and common pitfalls that can derail your analysis.
Quick Hits
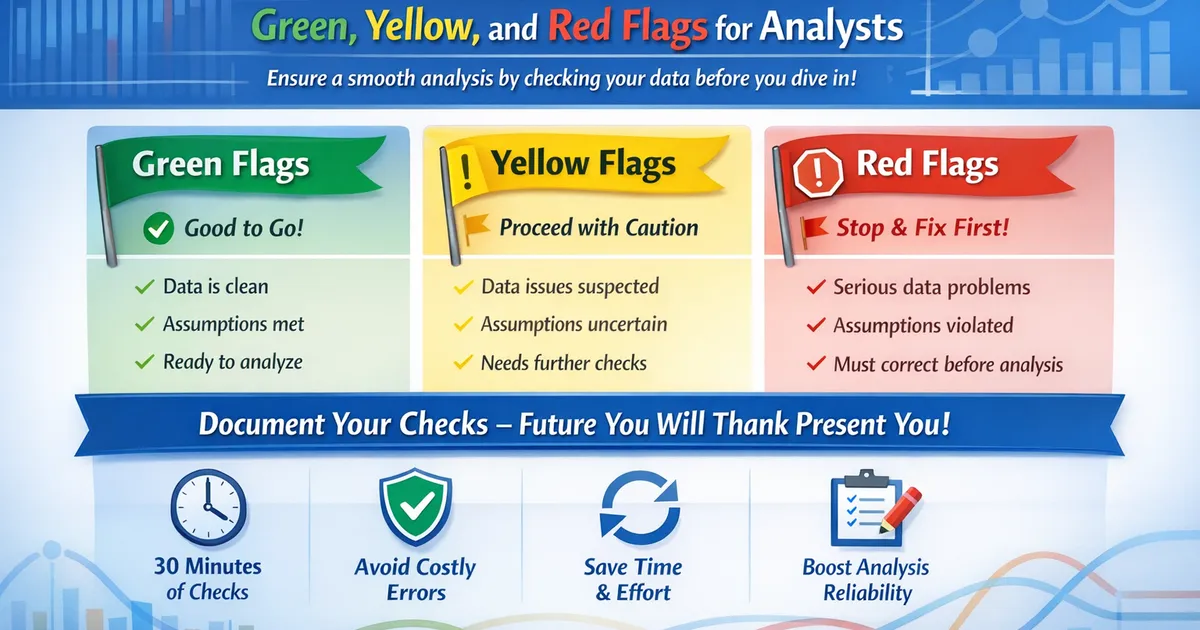
- •Green flags mean proceed with confidence
- •Yellow flags require investigation before proceeding
- •Red flags mean stop and address the issue first
- •Document your checks—future you will thank present you
TL;DR
Before diving into analysis, run through a systematic checklist. Green flags (proceed with confidence), yellow flags (investigate before proceeding), and red flags (stop and fix). Cover data quality, sample characteristics, assumption validity, and analysis setup. Document what you checked and what you found. This discipline prevents wasted time, unreliable results, and embarrassing mistakes.
The Complete Checklist
Phase 1: Data Quality
import numpy as np
import pandas as pd
from scipy import stats

def data_quality_checklist(df, key_columns=None):
    """
    Phase 1: Basic data quality checks.
    """
    print("=" * 60)
    print("PHASE 1: DATA QUALITY")
    print("=" * 60)

    flags = {'green': [], 'yellow': [], 'red': []}

    # 1.1 Basic shape
    print(f"\n1.1 Dataset Shape: {df.shape[0]:,} rows × {df.shape[1]} columns")

    if df.shape[0] < 30:
        flags['yellow'].append(f"Small sample size (n={df.shape[0]})")
    elif df.shape[0] < 10:
        flags['red'].append(f"Very small sample size (n={df.shape[0]})")
    else:
        flags['green'].append("Adequate sample size")

    # 1.2 Duplicates
    n_dupes = df.duplicated().sum()
    print(f"\n1.2 Duplicates: {n_dupes:,} ({n_dupes/len(df)*100:.2f}%)")

    if n_dupes > 0:
        if n_dupes / len(df) > 0.05:
            flags['red'].append(f"High duplicate rate ({n_dupes/len(df)*100:.1f}%)")
        else:
            flags['yellow'].append(f"Some duplicates present ({n_dupes})")
    else:
        flags['green'].append("No duplicates")

    # 1.3 Missing values
    print("\n1.3 Missing Values:")
    missing_pct = (df.isnull().sum() / len(df) * 100).sort_values(ascending=False)

    for col, pct in missing_pct.items():
        if pct > 0:
            print(f"    {col}: {pct:.1f}%")

    max_missing = missing_pct.max()
    if max_missing > 30:
        flags['red'].append(f"High missing rate (max {max_missing:.1f}%)")
    elif max_missing > 10:
        flags['yellow'].append(f"Moderate missing rate (max {max_missing:.1f}%)")
    elif max_missing > 0:
        flags['yellow'].append(f"Some missing values (max {max_missing:.1f}%)")
    else:
        flags['green'].append("No missing values")

    # 1.4 Data types
    print("\n1.4 Data Types:")
    unexpected_types = []
    for col in df.columns:
        if df[col].dtype == 'object':
            # Check if it should be numeric
            try:
                pd.to_numeric(df[col].dropna())
                unexpected_types.append(f"{col} (stored as string, may be numeric)")
            except:
                pass
        print(f"    {col}: {df[col].dtype}")

    if unexpected_types:
        flags['yellow'].append(f"Potential type issues: {unexpected_types}")
    else:
        flags['green'].append("Data types look appropriate")

    return flags


def print_flags(flags):
    """Print flags with color coding."""
    print("\n" + "=" * 60)
    print("FLAG SUMMARY")
    print("=" * 60)

    for color, items in flags.items():
        emoji = {'green': '✅', 'yellow': '⚠️', 'red': '🛑'}[color]
        label = color.upper()
        if items:
            print(f"\n{emoji} {label}:")
            for item in items:
                print(f"    {item}")

    # Verdict
    print("\n" + "-" * 60)
    if flags['red']:
        print("VERDICT: 🛑 RED FLAGS PRESENT - Address before proceeding")
    elif flags['yellow']:
        print("VERDICT: ⚠️ YELLOW FLAGS - Investigate, then proceed with caution")
    else:
        print("VERDICT: ✅ ALL CLEAR - Proceed with confidence")


# Example
np.random.seed(42)
df = pd.DataFrame({
    'user_id': range(100),
    'treatment': np.repeat([0, 1], 50),
    'outcome': np.random.normal(100, 15, 100),
    'segment': np.random.choice(['A', 'B', 'C'], 100)
})
df.loc[5:7, 'outcome'] = np.nan  # Add some missing

flags = data_quality_checklist(df)
print_flags(flags)
Phase 2: Sample Characteristics
def sample_characteristics_checklist(df, treatment_col, outcome_col, id_col=None):
    """
    Phase 2: Check sample characteristics.
    """
    print("=" * 60)
    print("PHASE 2: SAMPLE CHARACTERISTICS")
    print("=" * 60)

    flags = {'green': [], 'yellow': [], 'red': []}

    # 2.1 Group sizes
    print("\n2.1 Group Sizes:")
    group_sizes = df[treatment_col].value_counts()
    for group, size in group_sizes.items():
        print(f"    {group}: n={size}")

    size_ratio = group_sizes.max() / group_sizes.min()
    if size_ratio > 3:
        flags['yellow'].append(f"Unbalanced groups (ratio: {size_ratio:.1f})")
    else:
        flags['green'].append("Reasonably balanced groups")

    # 2.2 Per-group sample size
    min_size = group_sizes.min()
    if min_size < 10:
        flags['red'].append(f"Very small group (n={min_size})")
    elif min_size < 30:
        flags['yellow'].append(f"Small group size (n={min_size})")
    else:
        flags['green'].append("Adequate per-group sample size")

    # 2.3 Independence check (if ID provided)
    if id_col:
        n_unique = df[id_col].nunique()
        n_total = len(df)

        print(f"\n2.3 Independence Check:")
        print(f"    Total observations: {n_total}")
        print(f"    Unique IDs: {n_unique}")

        if n_unique < n_total:
            obs_per_id = n_total / n_unique
            flags['red'].append(
                f"Multiple observations per ID (avg: {obs_per_id:.1f}). "
                f"Address independence issue!"
            )
        else:
            flags['green'].append("One observation per ID")

    # 2.4 Outcome distribution by group
    print(f"\n2.4 Outcome Distribution by Group:")
    for group in df[treatment_col].unique():
        group_data = df[df[treatment_col] == group][outcome_col].dropna()
        print(f"    {group}: M={group_data.mean():.2f}, "
              f"SD={group_data.std():.2f}, "
              f"Skew={stats.skew(group_data):.2f}")

    return flags


# Continue example
flags2 = sample_characteristics_checklist(df, 'treatment', 'outcome', 'user_id')
print_flags(flags2)
Phase 3: Assumption Validity
def assumption_validity_checklist(df, treatment_col, outcome_col):
    """
    Phase 3: Check statistical assumptions.
    """
    print("=" * 60)
    print("PHASE 3: ASSUMPTION VALIDITY")
    print("=" * 60)

    flags = {'green': [], 'yellow': [], 'red': []}

    groups = [df[df[treatment_col] == g][outcome_col].dropna().values
              for g in df[treatment_col].unique()]

    # 3.1 Variance homogeneity
    print("\n3.1 Variance Homogeneity:")
    variances = [np.var(g, ddof=1) for g in groups]
    var_ratio = max(variances) / min(variances)
    print(f"    Variances: {[f'{v:.2f}' for v in variances]}")
    print(f"    Variance ratio: {var_ratio:.2f}")

    levene_stat, levene_p = stats.levene(*groups, center='median')
    print(f"    Levene's test: p = {levene_p:.4f}")

    if var_ratio > 4:
        flags['red'].append(f"Severe variance inequality (ratio: {var_ratio:.1f})")
    elif var_ratio > 2:
        flags['yellow'].append(f"Unequal variances (ratio: {var_ratio:.1f}) - use Welch")
    else:
        flags['green'].append("Variances reasonably similar")

    # 3.2 Normality/Skewness
    print("\n3.2 Normality/Skewness:")
    skewnesses = [stats.skew(g) for g in groups]
    for i, skew in enumerate(skewnesses):
        print(f"    Group {i}: skewness = {skew:.2f}")

    max_skew = max(abs(s) for s in skewnesses)
    min_n = min(len(g) for g in groups)

    if max_skew > 2 and min_n < 30:
        flags['yellow'].append(f"Severe skew ({max_skew:.1f}) with small n - consider robust methods")
    elif max_skew > 2:
        flags['yellow'].append(f"Severe skew ({max_skew:.1f}) - CLT may help but verify")
    elif max_skew > 1:
        flags['green'].append(f"Moderate skew ({max_skew:.1f}) - usually OK")
    else:
        flags['green'].append("Low skewness")

    # 3.3 Outliers
    print("\n3.3 Outliers:")
    all_data = np.concatenate(groups)
    z_scores = np.abs(stats.zscore(all_data))
    n_outliers = np.sum(z_scores > 3)
    print(f"    Points > 3 SD: {n_outliers}")

    if n_outliers > 0.05 * len(all_data):
        flags['yellow'].append(f"Many outliers ({n_outliers}) - consider robust methods")
    elif n_outliers > 0:
        flags['yellow'].append(f"Some outliers ({n_outliers}) - verify they're valid")
    else:
        flags['green'].append("No extreme outliers")

    return flags


# Continue example
flags3 = assumption_validity_checklist(df, 'treatment', 'outcome')
print_flags(flags3)
Phase 4: Analysis Setup
def analysis_setup_checklist(analysis_plan):
    """
    Phase 4: Verify analysis setup.
    """
    print("=" * 60)
    print("PHASE 4: ANALYSIS SETUP")
    print("=" * 60)

    flags = {'green': [], 'yellow': [], 'red': []}

    # 4.1 Hypothesis clarity
    print("\n4.1 Hypothesis:")
    if analysis_plan.get('hypothesis'):
        print(f"    {analysis_plan['hypothesis']}")
        flags['green'].append("Hypothesis clearly stated")
    else:
        flags['yellow'].append("No clear hypothesis stated")

    # 4.2 Primary metric
    print("\n4.2 Primary Metric:")
    if analysis_plan.get('primary_metric'):
        print(f"    {analysis_plan['primary_metric']}")
        flags['green'].append("Primary metric defined")
    else:
        flags['red'].append("No primary metric defined")

    # 4.3 Sample size / power
    print("\n4.3 Power/Sample Size:")
    if analysis_plan.get('power_analysis'):
        print(f"    {analysis_plan['power_analysis']}")
        flags['green'].append("Power analysis done")
    else:
        flags['yellow'].append("No power analysis documented")

    # 4.4 Multiple comparisons
    print("\n4.4 Multiple Comparisons:")
    n_tests = analysis_plan.get('n_tests', 1)
    print(f"    Number of tests: {n_tests}")

    if n_tests > 1:
        if analysis_plan.get('correction_method'):
            print(f"    Correction: {analysis_plan['correction_method']}")
            flags['green'].append("Multiple comparison correction planned")
        else:
            flags['yellow'].append(f"{n_tests} tests planned but no correction specified")
    else:
        flags['green'].append("Single test - no correction needed")

    # 4.5 Pre-registration
    print("\n4.5 Pre-Registration:")
    if analysis_plan.get('pre_registered'):
        print("    Analysis was pre-registered")
        flags['green'].append("Pre-registered analysis")
    else:
        print("    Not pre-registered")
        flags['yellow'].append("Not pre-registered - document decisions made")

    return flags


# Example analysis plan
analysis_plan = {
    'hypothesis': 'Treatment increases outcome compared to control',
    'primary_metric': 'outcome (continuous)',
    'power_analysis': '80% power to detect d=0.5 at alpha=0.05',
    'n_tests': 1,
    'correction_method': None,
    'pre_registered': False
}

flags4 = analysis_setup_checklist(analysis_plan)
print_flags(flags4)
Complete Pre-Analysis Report
def full_pre_analysis_check(df, treatment_col, outcome_col, id_col=None, analysis_plan=None):
    """
    Run complete pre-analysis checklist.
    """
    print("\n")
    print("╔" + "═" * 58 + "╗")
    print("║" + " PRE-ANALYSIS CHECKLIST ".center(58) + "║")
    print("╚" + "═" * 58 + "╝")

    all_flags = {'green': [], 'yellow': [], 'red': []}

    # Phase 1
    flags1 = data_quality_checklist(df)
    for color in all_flags:
        all_flags[color].extend(flags1[color])

    # Phase 2
    flags2 = sample_characteristics_checklist(df, treatment_col, outcome_col, id_col)
    for color in all_flags:
        all_flags[color].extend(flags2[color])

    # Phase 3
    flags3 = assumption_validity_checklist(df, treatment_col, outcome_col)
    for color in all_flags:
        all_flags[color].extend(flags3[color])

    # Phase 4
    if analysis_plan:
        flags4 = analysis_setup_checklist(analysis_plan)
        for color in all_flags:
            all_flags[color].extend(flags4[color])

    # Final summary
    print("\n")
    print("╔" + "═" * 58 + "╗")
    print("║" + " FINAL SUMMARY ".center(58) + "║")
    print("╚" + "═" * 58 + "╝")

    print_flags(all_flags)

    # Generate recommendations
    print("\n" + "=" * 60)
    print("RECOMMENDATIONS")
    print("=" * 60)

    if all_flags['red']:
        print("\n🛑 CRITICAL ISSUES TO ADDRESS:")
        for issue in all_flags['red']:
            print(f"    • {issue}")

    if all_flags['yellow']:
        print("\n⚠️ ITEMS TO INVESTIGATE:")
        for issue in all_flags['yellow']:
            print(f"    • {issue}")

    if not all_flags['red'] and not all_flags['yellow']:
        print("\n✅ All checks passed. Proceed with analysis.")
    elif not all_flags['red']:
        print("\n➡️  Address yellow flags, then proceed with appropriate adjustments.")
    else:
        print("\n🛑 Address red flags before proceeding with analysis.")

    return all_flags


# Run full check
analysis_plan = {
    'hypothesis': 'Treatment improves outcome',
    'primary_metric': 'outcome',
    'power_analysis': '80% power for d=0.4',
    'n_tests': 1,
    'pre_registered': False
}

full_pre_analysis_check(df, 'treatment', 'outcome', 'user_id', analysis_plan)
Quick Reference Card
Green flags (proceed):
- Adequate sample size (n > 30 per group)
- No duplicates
- Missing data < 5%
- Variance ratio < 2
- |Skewness| < 1
- One observation per unit
- Hypothesis clearly stated
- Primary metric defined
Yellow flags (investigate):
- Small sample (15 < n < 30)
- Missing data 5-20%
- Variance ratio 2-4 (use Welch)
- |Skewness| 1-2 (consider robust methods)
- Some outliers (verify validity)
- Multiple tests without correction plan
- Not pre-registered
Red flags (stop and fix):
- Very small sample (n < 15)
- Missing data > 30%
- Variance ratio > 4
- Multiple observations per unit (independence!)
- High duplicate rate (> 5%)
- No primary metric defined
- Data quality issues
R Implementation
# Pre-analysis checklist in R

pre_analysis_check <- function(df, treatment_col, outcome_col) {
  cat("\n=== PRE-ANALYSIS CHECKLIST ===\n\n")

  flags <- list(green = c(), yellow = c(), red = c())

  # Data quality
  cat("1. DATA QUALITY\n")
  cat(sprintf("   Rows: %d\n", nrow(df)))
  cat(sprintf("   Missing in outcome: %.1f%%\n",
              mean(is.na(df[[outcome_col]])) * 100))

  # Group sizes
  cat("\n2. GROUP SIZES\n")
  sizes <- table(df[[treatment_col]])
  print(sizes)
  ratio <- max(sizes) / min(sizes)
  cat(sprintf("   Size ratio: %.2f\n", ratio))

  if (ratio > 3) {
    flags$yellow <- c(flags$yellow, "Unbalanced groups")
  }

  # Assumptions
  cat("\n3. ASSUMPTIONS\n")
  groups <- split(df[[outcome_col]], df[[treatment_col]])

  # Variance
  vars <- sapply(groups, var, na.rm = TRUE)
  var_ratio <- max(vars) / min(vars)
  cat(sprintf("   Variance ratio: %.2f\n", var_ratio))

  if (var_ratio > 4) {
    flags$red <- c(flags$red, "Severe variance inequality")
  } else if (var_ratio > 2) {
    flags$yellow <- c(flags$yellow, "Use Welch's t-test")
  }

  # Skewness
  library(moments)
  skews <- sapply(groups, skewness, na.rm = TRUE)
  cat(sprintf("   Max skewness: %.2f\n", max(abs(skews))))

  # Summary
  cat("\n=== FLAG SUMMARY ===\n")
  if (length(flags$red) > 0) {
    cat("RED FLAGS:\n")
    cat(paste("  -", flags$red, collapse = "\n"), "\n")
  }
  if (length(flags$yellow) > 0) {
    cat("YELLOW FLAGS:\n")
    cat(paste("  -", flags$yellow, collapse = "\n"), "\n")
  }
  if (length(flags$red) == 0 && length(flags$yellow) == 0) {
    cat("All checks passed!\n")
  }

  invisible(flags)
}

# Usage:
# pre_analysis_check(df, "treatment", "outcome")
Documentation Template
1. Data overview. Dataset name, date range, total observations, unique units.
2. Data quality checks. Duplicates checked, missing data assessed (max %), data types verified, outliers identified (points > 3 SD).
3. Sample characteristics. Group sizes, balance check, independence verified.
4. Assumption checks. Variance ratio, max skewness, method chosen based on findings.
5. Analysis plan. Primary hypothesis, primary metric, statistical test, alpha level, multiple comparison correction method.
6. Flags and decisions. Document any red or yellow flags discovered and the decisions made to address them.
7. Sign-off. Confirm "ready to proceed" or list issues to address first.
Related Methods
- Assumption Checks Master Guide — The pillar article
- Audit Trails — Documenting decisions
- Common Analyst Mistakes — What to avoid
Key Takeaway
A systematic pre-analysis checklist prevents wasted effort and unreliable conclusions. Green flags mean proceed, yellow flags mean investigate, red flags mean stop and fix. The 30 minutes spent checking saves hours of redoing analyses and prevents embarrassing mistakes. Make this a habit—your future self (and your stakeholders) will thank you.
References
- https://doi.org/10.1177/2515245917747646
- https://www.jstor.org/stable/3802789
- Simmons, J. P., Nelson, L. D., & Simonsohn, U. (2011). False-positive psychology: Undisclosed flexibility in data collection and analysis allows presenting anything as significant. *Psychological Science*, 22(11), 1359-1366.
- Wicherts, J. M., et al. (2016). Degrees of freedom in planning, running, analyzing, and reporting psychological studies: A checklist to avoid p-hacking. *Frontiers in Psychology*, 7, 1832.
- Nosek, B. A., et al. (2018). The preregistration revolution. *Proceedings of the National Academy of Sciences*, 115(11), 2600-2606.
Frequently Asked Questions
How thorough should my pre-analysis checks be?
What if I find problems mid-analysis?
Should I automate these checks?
Key Takeaway
A systematic pre-analysis checklist prevents wasted effort and unreliable conclusions. Green flags let you proceed confidently, yellow flags require investigation, and red flags mean stop and fix first. The 30 minutes spent checking saves hours of redoing analyses and prevents embarrassing mistakes.