Contents
Audit Trails: How to Document Assumptions, Data Filters, and Analysis Decisions
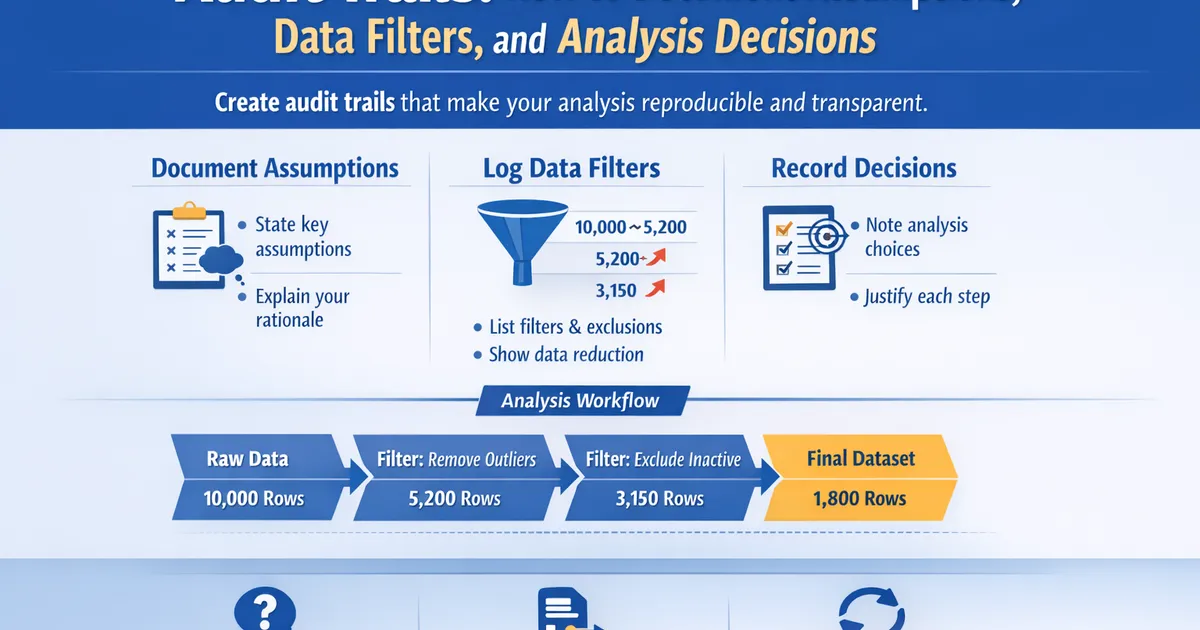
Build analysis audit trails that let anyone understand and reproduce your work. Document data filters, exclusions, assumptions, and decision points so future investigations are possible.
Quick Hits
- •An audit trail answers: 'Why did you make that decision?'
- •Document every filter, exclusion, and data transformation with rationale
- •Future you will forget why you excluded those 3,421 users—write it down now
- •Include counts at each step: raw data → after filter 1 → after filter 2...
- •Version control your queries and notebooks—not just the final report
TL;DR
An audit trail documents not just what you did, but why. Record every data filter (with counts), every assumption (with validation), and every decision point (with rationale). Version control queries and notebooks, not just final reports. Six months from now, when someone asks "why did you exclude those users?" you'll have the answer in seconds instead of spending hours reverse-engineering your own work.
Why Audit Trails Matter
The Scenario You Want to Avoid
3 months after analysis...

PM: "Hey, can you explain the user filter in the checkout experiment?"

You: *Opens old analysis*

You: "I filtered some users but... I don't remember why."
     "Let me check the query... no comments."
     "Let me check the notebook... just the final version."
     "Let me try to remember..."

PM: "The VP is asking because the exclusion affected their segment."

You: *Panics*
What Good Audit Trails Provide
| Without Audit Trail | With Audit Trail |
|---|---|
| "I think I filtered bots?" | "Bot filter: 3,421 users excluded (see definition)" |
| "Maybe there was a reason" | "Excluded: users with >100 sessions/day (automated)" |
| Hours of reconstruction | 30-second lookup |
| Uncertainty and doubt | Confidence and reproducibility |
The Audit Trail Framework
The Core Principle
For every analysis decision, document:
- What you did
- Why you did it
- How much it affected (counts)
- When you decided
The Analysis Log Template
# Analysis Log: [Experiment/Project Name]

## Metadata
- **Analyst**: [Name]
- **Start date**: [Date]
- **Last updated**: [Date]
- **Repository**: [Link to code]
- **Status**: [In progress / Complete / Under review]

---

## Data Source

| Field | Value |
|-------|-------|
| Database | analytics_prod |
| Tables | experiment_exposures, transactions |
| Date extracted | 2026-01-28 09:15 UTC |
| Date range | 2026-01-15 to 2026-01-28 |
| Query | /queries/checkout_v2/extract.sql (commit abc123) |

---

## Data Pipeline

### Step 1: Raw Extract
- **Count**: 152,847 user-experiment assignments
- **Query**: extract.sql
- **Notes**: Full population assigned to experiment

### Step 2: Bot Removal
- **Filter**: user_agent NOT IN (bot_patterns)
- **Removed**: 3,421 (2.2%)
- **Remaining**: 149,426
- **Rationale**: Bots inflate denominator, don't convert
- **Validation**: Spot-checked 50 removed; all automated traffic

### Step 3: Employee Removal
- **Filter**: email NOT LIKE '%@company.com'
- **Removed**: 156 (0.1%)
- **Remaining**: 149,270
- **Rationale**: Employee behavior differs from real users

### Step 4: Exposure Validation
- **Filter**: exposure_timestamp IS NOT NULL
- **Removed**: 0
- **Remaining**: 149,270
- **Notes**: All assigned users had valid exposures

### Step 5: Outlier Treatment
- **Treatment**: Winsorized revenue at 99th percentile ($847)
- **Affected**: 1,244 users (0.8%)
- **Rationale**: Extreme values (max $47,892) skewing mean
- **Sensitivity**: Also ran without Winsorization—results consistent

---

## Analysis Decisions

### Decision 1: Attribution Window
- **Choice**: 7-day attribution window
- **Alternatives considered**: 14-day, 30-day, session-based
- **Rationale**: 80% of conversions occur within 7 days historically
- **Date decided**: 2026-01-16 (pre-analysis plan)

### Decision 2: Statistical Test
- **Choice**: Two-proportion z-test
- **Alternatives considered**: Chi-square, Fisher's exact
- **Rationale**: Large sample size, standard for proportion comparisons
- **Assumptions checked**: Sample > 30, expected cell counts > 5

### Decision 3: Handling Zero-Revenue Users
- **Choice**: Include as $0 (ITT analysis)
- **Alternative**: Exclude non-purchasers (per-protocol)
- **Rationale**: ITT preserves randomization, answers business question
- **Sensitivity**: Also reported conversion rate separately

---

## Assumptions Log

| Assumption | Validation | Risk if Wrong |
|------------|------------|---------------|
| No SRM (sample ratio mismatch) | Chi-square p = 0.34 | Bias in estimates |
| Independence (users independent) | Randomization unit = user | Underestimated SE |
| Stable treatment during experiment | Checked deploy logs | Contamination |
| Bot filter comprehensive | Manual review of 50 | Undercount denominator |

---

## Version History

| Date | Change | Author |
|------|--------|--------|
| 2026-01-16 | Initial pre-analysis plan | [Name] |
| 2026-01-28 | Data extraction | [Name] |
| 2026-01-29 | Added sensitivity analysis per reviewer | [Name] |
| 2026-01-30 | Final report | [Name] |

---

## Open Questions / Future Work

- [ ] Mobile segment showed flat effect—worth deeper investigation?
- [ ] Consider 14-day window for next experiment
Documenting Data Filters
The Filter Documentation Pattern
Every data filter should include:
def document_filter(filter_name, filter_logic, rows_before, rows_after, rationale):
    """
    Template for documenting a data filter.
    """
    pct_removed = (rows_before - rows_after) / rows_before * 100

    doc = f"""
### Filter: {filter_name}
- **Logic**: {filter_logic}
- **Rows before**: {rows_before:,}
- **Rows removed**: {rows_before - rows_after:,} ({pct_removed:.1f}%)
- **Rows after**: {rows_after:,}
- **Rationale**: {rationale}
"""
    return doc


# Example
print(document_filter(
    filter_name="Bot Traffic Removal",
    filter_logic="user_agent NOT IN (known_bot_patterns)",
    rows_before=152847,
    rows_after=149426,
    rationale="Bots inflate session counts without converting; would bias conversion rate denominator"
))
The Funnel Approach
Document your data pipeline as a funnel with counts at each step:
def create_data_funnel(steps):
    """
    Create a visual data funnel for audit trail.
    """
    print("DATA FUNNEL")
    print("=" * 60)

    for i, step in enumerate(steps):
        pct_of_original = step['count'] / steps[0]['count'] * 100
        if i > 0:
            pct_of_previous = step['count'] / steps[i-1]['count'] * 100
            removed = steps[i-1]['count'] - step['count']
            print(f"    ↓ Removed: {removed:,} ({100-pct_of_previous:.1f}%)")

        print(f"\nStep {i+1}: {step['name']}")
        print(f"    Count: {step['count']:,} ({pct_of_original:.1f}% of original)")
        if step.get('rationale'):
            print(f"    Why: {step['rationale']}")


# Example
funnel_steps = [
    {'name': 'Raw extract', 'count': 152847, 'rationale': 'All experiment assignments'},
    {'name': 'Remove bots', 'count': 149426, 'rationale': 'Bots dont convert'},
    {'name': 'Remove employees', 'count': 149270, 'rationale': 'Different behavior'},
    {'name': 'Valid exposure', 'count': 149270, 'rationale': 'Actually saw treatment'},
    {'name': 'Final sample', 'count': 149270, 'rationale': 'Ready for analysis'},
]

create_data_funnel(funnel_steps)
Documenting Assumptions
Explicit Assumption Log
def create_assumption_log(assumptions):
    """
    Create structured assumption documentation.
    """
    print("ASSUMPTION LOG")
    print("=" * 70)
    print(f"{'Assumption':<25} {'Validation':<25} {'Risk if Violated'}")
    print("-" * 70)

    for a in assumptions:
        print(f"{a['assumption']:<25} {a['validation']:<25} {a['risk']}")


assumptions = [
    {
        'assumption': 'No SRM',
        'validation': 'Chi-sq p=0.34',
        'risk': 'Biased treatment effect'
    },
    {
        'assumption': 'User independence',
        'validation': 'Random assignment',
        'risk': 'Incorrect standard errors'
    },
    {
        'assumption': 'SUTVA (no spillover)',
        'validation': 'User-level randomization',
        'risk': 'Underestimate effect'
    },
    {
        'assumption': 'Stable treatment',
        'validation': 'Checked deploy logs',
        'risk': 'Inconsistent exposure'
    },
]

create_assumption_log(assumptions)
Documenting Assumption Violations
When an assumption is violated, document:
### Assumption Violation: Sample Ratio Mismatch

**Expected**: 50% Control, 50% Treatment
**Observed**: 48.2% Control, 51.8% Treatment
**SRM Test**: Chi-square p = 0.003

**Investigation**:
1. Checked assignment logic: No bugs found
2. Checked exposure timing: Found delay in Control assignment on Jan 17
3. Root cause: Deploy issue caused 2-hour assignment gap

**Resolution**:
- Excluded users assigned during 2-hour window (n=3,421)
- Re-ran SRM check: p = 0.41 (OK)

**Impact on Analysis**:
- Sample size reduced by 2.3%
- Documented in limitations section
Documenting Analysis Decisions
The Decision Log
## Decision Log

### Decision D-001: Primary Metric Choice
**Date**: 2026-01-14
**Decision**: Use purchase conversion rate as primary metric
**Alternatives Considered**:
- Revenue per user (rejected: higher variance, need larger sample)
- Checkout completion rate (rejected: doesn't capture full funnel)
**Rationale**: Directly measures business goal; historical data available for power calc
**Stakeholder Agreement**: PM, Eng Lead signed off

### Decision D-002: Outlier Handling
**Date**: 2026-01-28
**Decision**: Winsorize revenue at 99th percentile
**Triggered By**: Observed max revenue of $47,892 (10x 99th percentile)
**Alternatives Considered**:
- Remove outliers (rejected: lose data)
- Log transform (rejected: harder to interpret)
- No treatment (rejected: distorts mean)
**Rationale**: Caps influence of extremes while keeping all users
**Sensitivity**: Ran with/without; results directionally same

### Decision D-003: Post-Hoc Segment Analysis
**Date**: 2026-01-29
**Decision**: Add mobile vs desktop segment breakdown
**Triggered By**: Stakeholder request after seeing flat overall result
**Status**: Labeled as EXPLORATORY in report
**Rationale**: Answer stakeholder question while maintaining integrity
**Note**: Not pre-specified; requires replication before acting
Version Control for Analysis
What to Version Control
| Must Version | Nice to Version | Don't Version |
|---|---|---|
| SQL queries | Analysis notebooks | Intermediate outputs |
| Analysis scripts | Config files | Temp files |
| Pre-analysis plans | Documentation | Large data files |
| Final reports | Environment files |
Git Workflow for Analysts
# Project structure
experiments/
├── checkout_v2/
│   ├── pre_analysis_plan.md     # Version controlled
│   ├── queries/
│   │   ├── extract.sql          # Version controlled
│   │   └── secondary_metrics.sql
│   ├── analysis/
│   │   ├── main_analysis.py     # Version controlled
│   │   └── sensitivity.py
│   ├── reports/
│   │   └── final_report.md      # Version controlled
│   └── logs/
│       └── analysis_log.md      # Version controlled

# Key commits
git commit -m "Pre-analysis plan for checkout v2"
git commit -m "Add data extraction query"
git commit -m "Initial analysis - primary metric"
git commit -m "Add sensitivity analysis per review"
git commit -m "Final report"

# Tagging final versions
git tag -a "checkout-v2-final" -m "Analysis complete, shared with stakeholders"
Meaningful Commit Messages
# Good
git commit -m "Add bot filter: removed 3,421 users (2.2%)"
git commit -m "Change Winsorization from 99th to 97th percentile per review"
git commit -m "Add mobile segment analysis (exploratory)"

# Bad
git commit -m "Update analysis"
git commit -m "Fix"
git commit -m "Changes"
Query Documentation
Inline SQL Documentation
-- Checkout Experiment v2: Data Extract
-- Author: [Name]
-- Date: 2026-01-28
-- Purpose: Extract experiment data for primary analysis
--
-- Filters Applied:
--   1. Bot removal (user_agent filter)
--   2. Employee removal (email domain)
--   3. Date range: 2026-01-15 to 2026-01-28

SELECT
    e.user_id,
    e.variant,  -- 'control' or 'treatment'
    e.exposure_timestamp,
    -- Purchase conversion (7-day window)
    CASE
        WHEN t.transaction_id IS NOT NULL THEN 1
        ELSE 0
    END AS converted,
    -- Revenue (Winsorized at $847 = 99th percentile)
    LEAST(COALESCE(t.revenue, 0), 847) AS revenue_winsorized,
    COALESCE(t.revenue, 0) AS revenue_raw

FROM experiment_exposures e

LEFT JOIN transactions t
    ON e.user_id = t.user_id
    AND t.transaction_timestamp > e.exposure_timestamp
    AND t.transaction_timestamp < e.exposure_timestamp + INTERVAL '7 days'
    AND t.transaction_type = 'purchase'

WHERE e.experiment_name = 'checkout_v2'
    AND e.exposure_timestamp BETWEEN '2026-01-15' AND '2026-01-28'
    -- Bot filter (see bot_patterns.sql for full list)
    AND e.user_agent NOT IN (SELECT pattern FROM bot_patterns)
    -- Employee filter
    AND e.email NOT LIKE '%@company.com'
;

-- Row counts (for audit trail):
-- Total exposures: 152,847
-- After bot filter: 149,426 (-2.2%)
-- After employee filter: 149,270 (-0.1%)
R Implementation
# Function to create audit trail documentation
create_audit_trail <- function(
  project_name,
  analyst,
  data_source,
  filters,
  decisions
) {
  cat("# Audit Trail:", project_name, "\n\n")
  cat("**Analyst:**", analyst, "\n")
  cat("**Date:**", as.character(Sys.Date()), "\n")
  cat("**Data Source:**", data_source, "\n\n")

  cat("## Data Filters\n\n")
  for (f in filters) {
    pct <- (f$before - f$after) / f$before * 100
    cat("###", f$name, "\n")
    cat("- Before:", format(f$before, big.mark = ","), "\n")
    cat("- After:", format(f$after, big.mark = ","),
        sprintf("(%.1f%% removed)\n", pct))
    cat("- Rationale:", f$rationale, "\n\n")
  }

  cat("## Decisions\n\n")
  for (d in decisions) {
    cat("###", d$name, "\n")
    cat("- **Choice:**", d$choice, "\n")
    cat("- **Rationale:**", d$rationale, "\n\n")
  }
}

# Example usage
create_audit_trail(
  project_name = "Checkout v2 Analysis",
  analyst = "Data Team",
  data_source = "analytics_prod.experiment_exposures",
  filters = list(
    list(name = "Bot Removal", before = 152847, after = 149426,
         rationale = "Bots inflate denominator"),
    list(name = "Employee Removal", before = 149426, after = 149270,
         rationale = "Employee behavior differs")
  ),
  decisions = list(
    list(name = "Attribution Window", choice = "7 days",
         rationale = "80% of conversions within 7 days"),
    list(name = "Outlier Treatment", choice = "Winsorize at 99th",
         rationale = "Cap extreme values while keeping all users")
  )
)
Checklist: Audit Trail Completeness
## Audit Trail Checklist

### Data Source
□ Database/table documented?
□ Extraction date and time recorded?
□ Query versioned and linked?
□ Date range specified?

### Data Pipeline
□ All filters documented with counts?
□ Rationale for each filter included?
□ Counts at each pipeline step?
□ Exclusion percentages calculated?

### Assumptions
□ All assumptions explicitly stated?
□ Validation method for each assumption?
□ Risk assessment if assumption violated?
□ Any violations documented with resolution?

### Decisions
□ All major decisions logged?
□ Alternatives considered noted?
□ Rationale documented?
□ Decision date recorded?

### Version Control
□ Queries committed to git?
□ Analysis code committed?
□ Meaningful commit messages?
□ Final version tagged?

### Reproducibility
□ Could someone else run this analysis?
□ Software versions recorded?
□ Random seeds documented?
□ All parameters specified?
Related Articles
- Analytics Reporting (Pillar) - Complete reporting guide
- Writing Methods Sections - Documentation practices
- Pre-Registration Lite - Pre-analysis planning
- Common Analyst Mistakes - What to avoid
Key Takeaway
An audit trail documents not just what you did, but why. Record every data filter with its rationale and the count of rows affected. Log assumptions explicitly and note how you validated them. Include decision points with the alternatives you considered and why you chose what you chose. Version control everything—queries, scripts, and notebooks, not just the final report. Six months from now, when someone asks "why did you exclude those users?" or "why did you use this test?" you'll have the answer documented. That's the difference between confidence and panic, between a 30-second lookup and hours of reverse-engineering.
References
- https://doi.org/10.1038/d41586-018-06008-w
- https://www.equator-network.org/reporting-guidelines/
- Gentleman, R., & Temple Lang, D. (2007). Statistical analyses and reproducible research. *Journal of Computational and Graphical Statistics*, 16(1), 1-23.
- Peng, R. D. (2011). Reproducible research in computational science. *Science*, 334(6060), 1226-1227.
- Wilson, G., et al. (2017). Good enough practices in scientific computing. *PLoS Computational Biology*, 13(6), e1005510.
Frequently Asked Questions
How much detail is too much?
Should I document obvious decisions?
How do I maintain audit trails without slowing down?
Key Takeaway
An audit trail documents not just what you did, but why. Record every data filter with its rationale and the count of rows affected. Log assumptions explicitly: 'Assumed bot filter catches all automated traffic—validated against user_agent patterns.' Include decision points: 'Chose Winsorization at 99th percentile because 1% of users had extreme values affecting the mean.' Version control everything. Six months from now, when someone asks 'why did you exclude those users?' you'll have the answer in seconds, not hours of reverse-engineering.