Contents
Common Analyst Mistakes: P-Hacking, Metric Slicing, and Post-Hoc Stories
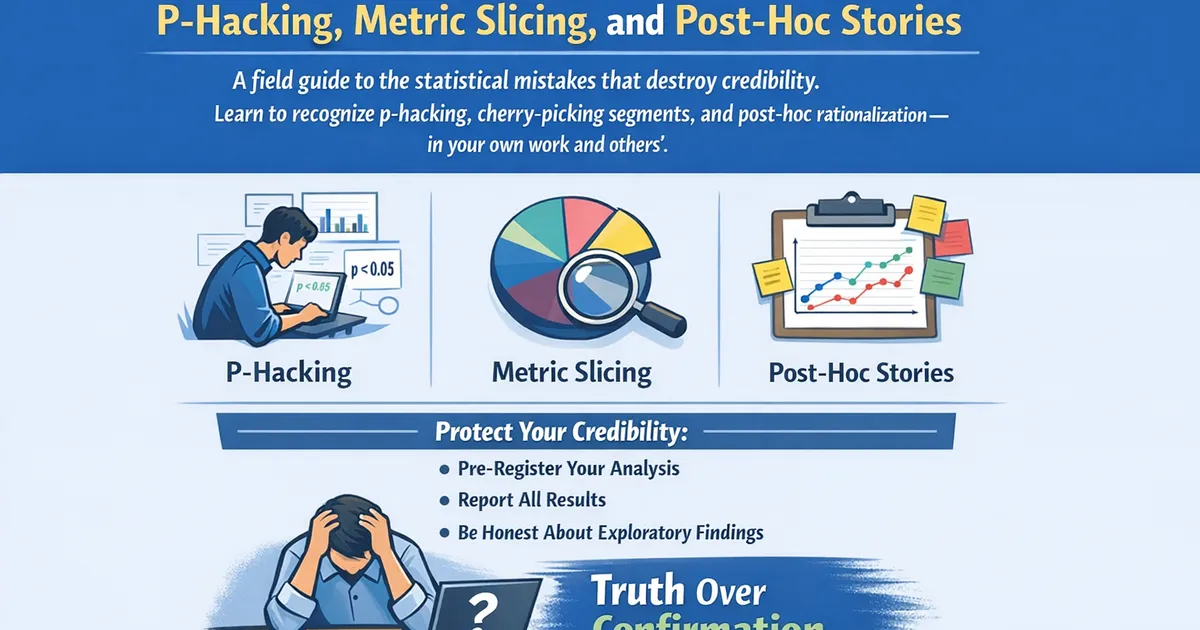
A field guide to the statistical mistakes that destroy credibility. Learn to recognize p-hacking, cherry-picking segments, and post-hoc rationalization—in your own work and others'.
Quick Hits
- •P-hacking: trying analyses until p < 0.05, then reporting only the 'winner'
- •Metric slicing: finding the one segment where your hypothesis works
- •HARKing: Hypothesizing After Results are Known—presenting exploration as confirmation
- •The fix: pre-register, report all analyses, label exploratory findings honestly
- •Your future credibility depends on admitting what you don't know
TL;DR
The most damaging analyst mistakes aren't math errors—they're p-hacking (trying analyses until significant), metric slicing (cherry-picking favorable segments), and HARKing (presenting exploration as confirmation). These practices inflate false positives and, once discovered, destroy your credibility permanently. The fix: pre-register your approach, report all pre-specified analyses, clearly label exploration, and be honest about what you don't know.
The Landscape of Analyst Mistakes
Why Smart People Make These Mistakes
Every analyst faces pressure to deliver positive results. The path from "honest analysis" to "misleading report" is paved with small, individually reasonable decisions:
Start with honest question
       ↓
Run analysis, result not significant
       ↓
"Let me try a different approach"  ← First step down the path
       ↓
Try 5 approaches, one is significant
       ↓
"This was really the right approach"  ← Rationalization
       ↓
Report only the significant result
       ↓
False positive presented as discovery
The Three Cardinal Sins
| Mistake | What It Is | Why It's Harmful |
|---|---|---|
| P-hacking | Trying analyses until | Inflates false positive rate to 50%+ |
| Metric slicing | Finding the segment that works | Same as above, but hidden in subgroups |
| HARKing | Post-hoc hypothesis as a priori | Makes exploration look like confirmation |
P-Hacking: The Silent Epidemic
What P-Hacking Looks Like
import numpy as np
from scipy import stats


def demonstrate_p_hacking():
    """
    Show how p-hacking inflates false positives.
    """
    np.random.seed(42)

    # Truth: No real effect (both groups from same distribution)
    n_simulations = 1000
    p_hacking_successes = 0
    honest_successes = 0

    for _ in range(n_simulations):
        # Generate null data (no true effect)
        control = np.random.normal(100, 15, 100)
        treatment = np.random.normal(100, 15, 100)  # Same distribution!

        # Honest analysis: one pre-specified test
        _, p_honest = stats.ttest_ind(control, treatment)
        if p_honest < 0.05:
            honest_successes += 1

        # P-hacking: try multiple approaches, report best
        p_values = []

        # Approach 1: Standard t-test
        _, p1 = stats.ttest_ind(control, treatment)
        p_values.append(p1)

        # Approach 2: Remove "outliers" (> 2 SD from mean)
        c_filtered = control[np.abs(control - control.mean()) < 2 * control.std()]
        t_filtered = treatment[np.abs(treatment - treatment.mean()) < 2 * treatment.std()]
        if len(c_filtered) > 10 and len(t_filtered) > 10:
            _, p2 = stats.ttest_ind(c_filtered, t_filtered)
            p_values.append(p2)

        # Approach 3: Mann-Whitney
        _, p3 = stats.mannwhitneyu(control, treatment, alternative='two-sided')
        p_values.append(p3)

        # Approach 4: One-tailed test
        _, p4 = stats.ttest_ind(control, treatment)
        p_values.append(p4 / 2)  # Convert to one-tailed

        # Approach 5: Log transform
        _, p5 = stats.ttest_ind(np.log(control + 1), np.log(treatment + 1))
        p_values.append(p5)

        # P-hacker reports best result
        if min(p_values) < 0.05:
            p_hacking_successes += 1

    print("P-Hacking Demonstration (No True Effect)")
    print("=" * 50)
    print(f"Honest analysis false positive rate: {honest_successes/n_simulations:.1%}")
    print(f"P-hacking false positive rate: {p_hacking_successes/n_simulations:.1%}")
    print(f"\nP-hacking inflates false positives by: {p_hacking_successes/honest_successes:.1f}x")


demonstrate_p_hacking()
Common P-Hacking Techniques
| Technique | How It Works | Red Flag |
|---|---|---|
| Test shopping | Try t-test, Mann-Whitney, permutation until one works | "We used X test because it's more appropriate" |
| Outlier removal | Remove data points until significant | Arbitrary exclusion criteria |
| Covariate fishing | Add/remove covariates until significant | "Controlling for X reveals the effect" |
| Transform shopping | Try log, sqrt, rank until significant | Post-hoc transformation choice |
| Stopping early | Stop collecting data when | Surprisingly small sample sizes |
| One-tailed switch | Switch to one-tailed when two-tailed fails | "We expected a positive effect" |
The Math: Why P-Hacking Works (For Finding False Positives)
With k independent tests at :
def false_positive_inflation(k_tests, alpha=0.05):
    """
    Calculate inflated false positive rate from multiple testing.
    """
    actual_rate = 1 - (1 - alpha) ** k_tests
    return actual_rate


print("False Positive Rate vs Number of Tests")
print("=" * 40)
for k in [1, 5, 10, 20, 50]:
    rate = false_positive_inflation(k)
    print(f"{k:>3} tests: {rate:.1%} false positive rate")
Metric Slicing: Death by Segmentation
The Pattern
- Overall result is null ()
- Try segments: age groups, platforms, countries...
- Find one where treatment wins
- Report segment result as main finding
Why It's Problematic
def demonstrate_metric_slicing():
    """
    Show how slicing by segments inflates false positives.
    """
    np.random.seed(42)

    n_simulations = 1000
    n_segments = 10  # Try 10 different segment cuts
    n_per_segment = 100

    found_significant_segment = 0

    for _ in range(n_simulations):
        # Generate null data (no true effect in any segment)
        significant_in_any = False

        for segment in range(n_segments):
            control = np.random.normal(0, 1, n_per_segment)
            treatment = np.random.normal(0, 1, n_per_segment)  # No effect!

            _, p = stats.ttest_ind(control, treatment)
            if p < 0.05:
                significant_in_any = True
                break

        if significant_in_any:
            found_significant_segment += 1

    print("Metric Slicing Demonstration")
    print("=" * 50)
    print(f"Number of segments tested: {n_segments}")
    print(f"True effect: None (null hypothesis is true)")
    print(f"Found 'significant' segment: {found_significant_segment/n_simulations:.1%} of simulations")
    print(f"\nExpected with proper testing: 5%")
    print(f"Actual with slicing: {found_significant_segment/n_simulations:.1%}")


demonstrate_metric_slicing()
The Telltale Signs
| What You See | What It Might Mean |
|---|---|
| "Works for iOS but not Android" | Tried both, reported the winner |
| "Significant for new users" | Tried new vs returning, reported winner |
| "Effect strongest in 25-34 age group" | Tried all age groups, reported winner |
| Overall result not mentioned | Overall was null, buried it |
The Interaction Test You're Skipping
def proper_segment_analysis(overall_diff, segment_a_diff, segment_b_diff,
                             se_overall, se_a, se_b):
    """
    Proper way to test if segments truly differ.
    """
    # Step 1: Report overall effect
    print("Step 1: Overall Effect")
    print(f"  Difference: {overall_diff:.1%} (SE: {se_overall:.1%})")
    z_overall = overall_diff / se_overall
    p_overall = 2 * (1 - stats.norm.cdf(abs(z_overall)))
    print(f"  p-value: {p_overall:.3f}")

    # Step 2: If exploring segments, TEST THE INTERACTION
    print("\nStep 2: Segment Comparison (Interaction Test)")

    diff_of_diffs = segment_a_diff - segment_b_diff
    se_interaction = np.sqrt(se_a**2 + se_b**2)
    z_interaction = diff_of_diffs / se_interaction
    p_interaction = 2 * (1 - stats.norm.cdf(abs(z_interaction)))

    print(f"  Segment A effect: {segment_a_diff:.1%}")
    print(f"  Segment B effect: {segment_b_diff:.1%}")
    print(f"  Difference in effects: {diff_of_diffs:.1%}")
    print(f"  Interaction p-value: {p_interaction:.3f}")

    if p_interaction > 0.05:
        print("\n  ⚠️  No significant interaction - segments may not truly differ!")
        print("     Both could be consistent with the overall effect.")


# Example: Mobile shows +5%, Desktop shows +1%
# Does mobile really work better?
proper_segment_analysis(
    overall_diff=0.03,
    segment_a_diff=0.05,  # Mobile
    segment_b_diff=0.01,  # Desktop
    se_overall=0.015,
    se_a=0.02,
    se_b=0.02
)
HARKing: Hypothesizing After Results are Known
The Mechanism
- Run experiment with vague hypothesis
- Find unexpected pattern in data
- Construct story explaining pattern
- Present as if you predicted it
Why It Destroys Credibility
What actually happened:
- Hypothesis: "New feature will improve engagement"
- Result: overall engagement flat (p = 0.6)
- Explored: tried 15 different metrics
- Found: "Time in settings" increased (p = 0.03)
- Story: "Users are engaging more deeply with customization"
What gets reported:
"We hypothesized that the new feature would increase user engagement with settings..."
The problem:
- 1 in 20 metrics will be "significant" by chance
- Post-hoc story makes it sound confirmatory
- Reader has no way to know this was data-dredging
- Finding will likely not replicate
Pre-Registered vs Post-Hoc
| Pre-Registered | Post-Hoc |
|---|---|
| "Our primary metric is conversion rate" | "Conversion rate turned out to be interesting" |
| Written before seeing data | Constructed after seeing data |
| Confirmatory (can trust p-value) | Exploratory (p-value is nominal) |
| Can replicate | May not replicate |
How to Report Post-Hoc Findings Honestly
## Post-Hoc Observations

*Note: The following findings emerged from exploratory analysis and
were not pre-specified. They should be treated as hypothesis-generating,
not hypothesis-confirming, and require replication before being acted upon.*

In exploring secondary metrics, we observed that time-in-settings
increased by 12% (p = 0.03, unadjusted). This was not our primary
hypothesis and may represent a chance finding given the multiple
comparisons involved.

**Recommendation**: If this finding is of business interest, design
a focused replication study with time-in-settings as the pre-registered
primary metric.
The Garden of Forking Paths
Every Decision Is a Fork
Data collected
    ↓
Include all users or filter? ─┬─ Include all
                              └─ Filter bots → Which definition?
    ↓
Which metric? ─┬─ Conversion rate
               ├─ Revenue per user
               └─ Sessions per user
    ↓
Which test? ─┬─ t-test
             ├─ Mann-Whitney
             └─ Bootstrap
    ↓
Handle outliers? ─┬─ Keep all
                  ├─ Winsorize at 95th
                  └─ Remove > 3 SD
    ↓
One-tailed or two? ─┬─ Two-tailed
                    └─ One-tailed
    ↓
Significance threshold? ─┬─ 0.05
                         └─ 0.10 (for "directional" findings)
Each fork doubles the paths. 6 binary decisions = 64 possible analyses.
Quantifying Researcher Degrees of Freedom
def count_researcher_degrees_of_freedom():
    """
    Estimate how many different analyses could be run on typical experiment data.
    """
    decisions = {
        'user_filter': ['all', 'active_only', 'no_bots', 'no_bots_active'],
        'primary_metric': ['conversion', 'revenue', 'engagement', 'retention'],
        'metric_definition': ['standard', 'adjusted', 'per_session'],
        'test_type': ['t_test', 'mann_whitney', 'bootstrap', 'permutation'],
        'outlier_handling': ['none', 'winsorize_95', 'winsorize_99', 'remove'],
        'covariate_adjustment': ['none', 'pre_period', 'demographics', 'both'],
        'significance_level': ['0.05', '0.10'],
        'tail': ['two', 'one']
    }

    n_combinations = 1
    for decision, options in decisions.items():
        n_combinations *= len(options)

    print("Researcher Degrees of Freedom")
    print("=" * 50)
    for decision, options in decisions.items():
        print(f"{decision}: {len(options)} options")

    print(f"\nTotal possible analyses: {n_combinations:,}")
    print(f"\nIf each has 5% false positive rate and you pick the best:")
    print(f"Effective false positive rate: essentially 100%")


count_researcher_degrees_of_freedom()
Prevention: Pre-Registration
What to Pre-Register
# Pre-Analysis Plan: Feature X Experiment

**Date written**: 2026-01-15 (before data collection)
**Author**: [Name]
**Locked**: [Link to timestamped commit/doc]

## Primary Analysis
- **Metric**: Purchase conversion rate
- **Definition**: Purchases / unique visitors
- **Test**: Two-sample proportion test
- **Significance level**: $\alpha = 0.05$, two-tailed
- **MDE**: 2% relative lift

## Sample
- **Inclusion**: All users exposed to experiment
- **Exclusions**: Bot traffic (defined by user_agent filter in code)
- **Minimum sample**: 50,000 per group

## Secondary Metrics
1. Revenue per user
2. Add-to-cart rate
3. Page load time (guardrail)

*Note: Secondary metrics are exploratory and will be reported
with unadjusted p-values. Significant findings require replication.*

## Pre-Specified Segments
1. New vs returning users
2. Mobile vs desktop

*Note: Segment analyses are exploratory. We will test for
interaction effects; segment-specific findings without significant
interactions will be treated cautiously.*

## What We Will NOT Do
- Change primary metric after seeing results
- Remove outliers except as defined above
- Report only favorable segments
- Switch to one-tailed test
Lightweight Pre-Registration for Fast-Moving Teams
Pre-Analysis Checklist (complete before analyzing results):
- Primary metric: ___
- Primary test: ___
- Significance level: ___
- User filter definition: ___
- Planned sample size: ___
Secondary/Exploratory:
- Secondary metrics (list): ___
- Pre-specified segments (list): ___
Commit or timestamp this document before pulling results.
Recovery: What to Do When You've Already Made the Mistake
If You've P-Hacked
- Acknowledge it (at least to yourself)
- Report all analyses you tried, not just the winner
- Adjust for multiple comparisons (Bonferroni or FDR)
- Label findings as exploratory
- Plan a replication with pre-registered analysis
If You've Sliced Metrics
- Report the overall result first
- Show all segments, not just the winner
- Test the interaction (are segments really different?)
- Adjust p-values for number of segments
- Caveat heavily if no significant interaction
If You've HARKed
- Reframe as exploratory: "We observed..." not "We hypothesized..."
- Acknowledge the search: "In examining secondary metrics..."
- Call for replication: "This finding should be replicated with a focused design"
- Don't overstate: "Suggestive evidence" not "We found that..."
R Implementation
# Demonstrate p-hacking inflation
demonstrate_p_hacking <- function(n_sims = 1000) {
  honest_success <- 0
  phacking_success <- 0

  for (i in 1:n_sims) {
    # Null data (no true effect)
    control <- rnorm(100, 100, 15)
    treatment <- rnorm(100, 100, 15)

    # Honest: one test
    p_honest <- t.test(control, treatment)$p.value
    if (p_honest < 0.05) honest_success <- honest_success + 1

    # P-hacking: try multiple approaches
    p_values <- c(
      t.test(control, treatment)$p.value,
      wilcox.test(control, treatment)$p.value,
      t.test(log(control), log(treatment))$p.value,
      t.test(control, treatment, alternative = "less")$p.value
    )

    if (min(p_values) < 0.05) phacking_success <- phacking_success + 1
  }

  cat("Honest FP rate:", honest_success / n_sims, "\n")
  cat("P-hacking FP rate:", phacking_success / n_sims, "\n")
}

# Proper segment comparison
test_segment_interaction <- function(effect_a, se_a, effect_b, se_b) {
  diff <- effect_a - effect_b
  se_diff <- sqrt(se_a^2 + se_b^2)
  z <- diff / se_diff
  p <- 2 * pnorm(-abs(z))

  cat("Segment A effect:", effect_a, "\n")
  cat("Segment B effect:", effect_b, "\n")
  cat("Difference:", diff, "\n")
  cat("Interaction p-value:", round(p, 4), "\n")

  if (p > 0.05) {
    cat("\nNo significant interaction - segments may not truly differ!\n")
  }
}
Self-Audit Checklist
Before Finalizing Any Analysis:

□ Did I specify my primary metric before seeing results?
□ Am I reporting ALL pre-specified analyses (including nulls)?
□ Are exploratory findings clearly labeled as such?
□ Did I try multiple approaches and pick the best one?
□ Would I be comfortable if a colleague reviewed my analysis log?
□ Am I reporting because it's significant, or because it answers my question?
□ If a segment "worked," did I test the interaction?
□ Are my conclusions supported by pre-specified analyses?
□ Have I disclosed everything that might affect interpretation?
□ Would this analysis replicate if someone else ran it?
Related Articles
- Analytics Reporting (Pillar) - Complete reporting guide
- Pre-Registration Lite - Practical pre-registration
- Multiple Testing Correction - FDR and Bonferroni
- When to Say Inconclusive - Handling null results
Key Takeaway
The most damaging analyst mistakes aren't computational—they're selective reporting and post-hoc storytelling. P-hacking inflates false positives to 50%+ by trying until significant. Metric slicing finds the one winning segment out of many. HARKing presents data-driven exploration as hypothesis confirmation. All three destroy trust when discovered—and they're often discovered. The antidotes are straightforward: pre-register your analysis plan, report all pre-specified analyses regardless of results, clearly label exploratory findings, and have the integrity to say "we didn't find what we expected." Your long-term credibility depends on honesty, not on always delivering positive results.
References
- https://doi.org/10.1177/0956797611417632
- https://doi.org/10.1037/a0033242
- https://www.microsoft.com/en-us/research/publication/top-challenges-from-the-first-practical-online-controlled-experiments-summit/
- Simmons, J. P., Nelson, L. D., & Simonsohn, U. (2011). False-positive psychology: Undisclosed flexibility in data collection and analysis allows presenting anything as significant. *Psychological Science*, 22(11), 1359-1366.
- Kerr, N. L. (1998). HARKing: Hypothesizing after the results are known. *Personality and Social Psychology Review*, 2(3), 196-217.
- Gelman, A., & Loken, E. (2014). The garden of forking paths: Why multiple comparisons can be a problem, even when there is no "fishing expedition." *Department of Statistics, Columbia University*.
Frequently Asked Questions
How do I know if I'm p-hacking?
Is exploratory analysis always wrong?
What if my stakeholders pressure me to find positive results?
Key Takeaway
The most damaging analyst mistakes aren't computational errors—they're selective reporting and post-hoc storytelling. P-hacking (trying until significant), metric slicing (finding the winning segment), and HARKing (presenting exploration as hypothesis testing) all inflate false positives and destroy trust. The antidotes: pre-register your analysis plan, report all pre-specified analyses regardless of results, clearly label exploratory findings, and have the integrity to say 'we didn't find what we expected.' Your credibility is built on honesty, not on always delivering positive results.