Contents
Two-Way ANOVA vs. Regression: Understanding Interactions for Product Teams
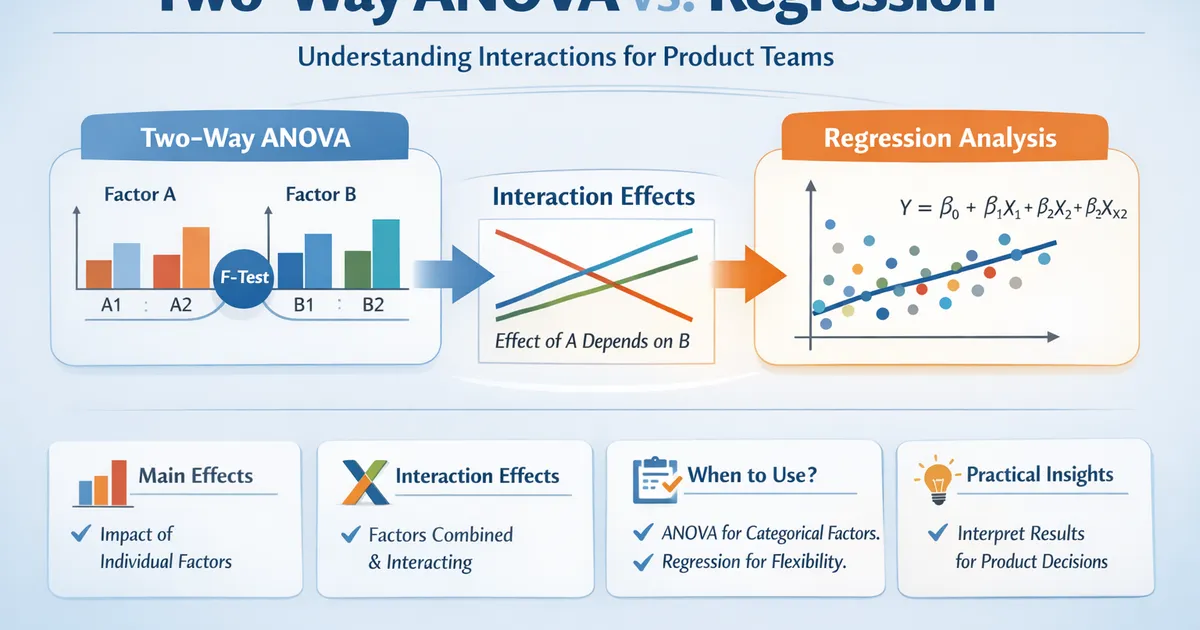
When to use two-way ANOVA versus regression for analyzing experiments with multiple factors. Covers interactions, main effects, and practical interpretation for product analytics.
Quick Hits
- •Two-way ANOVA and regression with dummy variables give identical results
- •Interactions mean the effect of one factor depends on the level of another
- •Test interactions first—if significant, main effects alone are misleading
- •Regression is more flexible; ANOVA is often easier to interpret and communicate
TL;DR
Two-way ANOVA analyzes experiments with two categorical factors, decomposing variance into main effects and interactions. It's mathematically identical to regression with dummy variables. The critical concept is interaction: when the effect of Factor A depends on the level of Factor B. Always test interactions first—if present, main effects alone are misleading.
The Setup: Factorial Designs
You're testing two factors simultaneously:
- Factor A: New feature (present/absent)
- Factor B: Device type (mobile/desktop)
Instead of running separate experiments, a factorial design tests all combinations:
| Desktop | Mobile | |
|---|---|---|
| Control | Cell 1 | Cell 2 |
| Treatment | Cell 3 | Cell 4 |
This design lets you estimate:
- Main effect of A: Overall treatment effect (averaging across devices)
- Main effect of B: Overall device effect (averaging across treatment)
- A × B Interaction: Does treatment effect differ by device?
Main Effects vs. Interactions
Main Effects
The average effect of a factor, ignoring (averaging over) the other factor.
import numpy as np
import pandas as pd
from scipy import stats

# Example data: 2x2 factorial
np.random.seed(42)

data = {
    'control_desktop': np.random.normal(50, 10, 50),
    'control_mobile': np.random.normal(48, 10, 50),
    'treatment_desktop': np.random.normal(52, 10, 50),
    'treatment_mobile': np.random.normal(58, 10, 50)  # Big mobile lift!
}

# Calculate cell means
means = {k: np.mean(v) for k, v in data.items()}
print("Cell means:")
for k, v in means.items():
    print(f"  {k}: {v:.1f}")

# Main effect of treatment (averaging across device)
treatment_effect = ((means['treatment_desktop'] + means['treatment_mobile']) / 2 -
                   (means['control_desktop'] + means['control_mobile']) / 2)
print(f"\nMain effect of treatment: {treatment_effect:.1f}")

# Main effect of device (averaging across treatment)
device_effect = ((means['control_mobile'] + means['treatment_mobile']) / 2 -
                (means['control_desktop'] + means['treatment_desktop']) / 2)
print(f"Main effect of device (mobile - desktop): {device_effect:.1f}")
Interactions
The effect of one factor depends on the level of another.
# Interaction: Does treatment effect differ by device?
treatment_effect_desktop = means['treatment_desktop'] - means['control_desktop']
treatment_effect_mobile = means['treatment_mobile'] - means['control_mobile']

print(f"\nTreatment effect on desktop: {treatment_effect_desktop:.1f}")
print(f"Treatment effect on mobile: {treatment_effect_mobile:.1f}")
print(f"Interaction (difference): {treatment_effect_mobile - treatment_effect_desktop:.1f}")
In this example, treatment helps mobile users much more than desktop users—that's an interaction.
Two-Way ANOVA
Python Implementation
import statsmodels.api as sm
from statsmodels.formula.api import ols

def two_way_anova(df, outcome, factor_a, factor_b):
    """
    Two-way ANOVA with interaction.
    """
    formula = f'{outcome} ~ C({factor_a}) * C({factor_b})'
    model = ols(formula, data=df).fit()
    anova_table = sm.stats.anova_lm(model, typ=2)

    return model, anova_table


# Prepare data
df = pd.DataFrame({
    'outcome': np.concatenate([data['control_desktop'], data['control_mobile'],
                               data['treatment_desktop'], data['treatment_mobile']]),
    'treatment': np.repeat(['control', 'control', 'treatment', 'treatment'], 50),
    'device': np.repeat(['desktop', 'mobile', 'desktop', 'mobile'], 50)
})

model, anova_table = two_way_anova(df, 'outcome', 'treatment', 'device')
print("Two-Way ANOVA Table:")
print(anova_table)
R Implementation
# Two-way ANOVA
model <- aov(outcome ~ treatment * device, data = df)
summary(model)

# Type III sums of squares (preferred for unbalanced designs)
library(car)
Anova(model, type = 3)
Interpreting the Output
The ANOVA table shows:
- treatment: Main effect of treatment
- device: Main effect of device
- treatment:device: Interaction effect
Critical rule: If interaction is significant, interpret main effects cautiously. A significant main effect of treatment may be driven entirely by one device type.
Regression Equivalent
Two-way ANOVA is identical to regression with dummy variables.
def regression_approach(df, outcome, factor_a, factor_b):
    """
    Regression equivalent to two-way ANOVA.
    """
    # Create dummy variables
    df = df.copy()
    df['treatment_dummy'] = (df[factor_a] == 'treatment').astype(int)
    df['device_dummy'] = (df[factor_b] == 'mobile').astype(int)
    df['interaction'] = df['treatment_dummy'] * df['device_dummy']

    X = sm.add_constant(df[['treatment_dummy', 'device_dummy', 'interaction']])
    y = df[outcome]

    model = sm.OLS(y, X).fit()

    return model


reg_model = regression_approach(df, 'outcome', 'treatment', 'device')
print("\nRegression Coefficients:")
print(reg_model.summary().tables[1])
Interpreting Coefficients
- const: Mean of reference group (control, desktop)
- treatment_dummy: Treatment effect when device = desktop (simple effect)
- device_dummy: Mobile effect when treatment = control (simple effect)
- interaction: Additional treatment effect on mobile (how much more treatment helps mobile vs. desktop)
When Interactions Matter
Crossover Interaction
Treatment helps one group but hurts another:
# Crossover interaction example
crossover_data = {
    'control_desktop': np.random.normal(50, 10, 50),
    'control_mobile': np.random.normal(50, 10, 50),
    'treatment_desktop': np.random.normal(55, 10, 50),  # Helps desktop
    'treatment_mobile': np.random.normal(45, 10, 50)    # Hurts mobile!
}

# Main effect might show no difference (effects cancel out)
# But interaction reveals the real story
Ordinal Interaction
Treatment helps both groups, but more for one:
# Ordinal interaction (our original example)
# Treatment helps both, but mobile benefits more
# Main effect still meaningful but incomplete
Visualization
import matplotlib.pyplot as plt

def interaction_plot(df, outcome, factor_a, factor_b):
    """
    Create interaction plot showing cell means.
    """
    means = df.groupby([factor_a, factor_b])[outcome].mean().unstack()

    fig, ax = plt.subplots(figsize=(8, 6))

    for col in means.columns:
        ax.plot(means.index, means[col], marker='o', linewidth=2, label=col)

    ax.set_xlabel(factor_a)
    ax.set_ylabel(f'Mean {outcome}')
    ax.set_title('Interaction Plot')
    ax.legend(title=factor_b)

    # Parallel lines = no interaction
    # Non-parallel lines = interaction
    plt.tight_layout()
    return fig


interaction_plot(df, 'outcome', 'treatment', 'device')
plt.show()
Interpreting interaction plots:
- Parallel lines → No interaction
- Non-parallel lines → Interaction present
- Crossing lines → Crossover interaction
When to Use Which
| Situation | Recommended |
|---|---|
| Two categorical factors | Either (equivalent) |
| Categorical + continuous | Regression (ANCOVA) |
| Multiple continuous | Regression |
| Need simple effect tests | Regression |
| Communication to non-stats audience | ANOVA (terms are clearer) |
| Unbalanced design | Regression (or Type III ANOVA) |
Common Mistakes
Ignoring Interactions
Testing only main effects misses the story. Always include interactions initially; remove only if clearly non-significant.
Interpreting Main Effects with Significant Interaction
With a crossover interaction, main effects can be zero or misleading. Report simple effects (effect at each level of the other factor) instead.
Type I vs. Type III Sums of Squares
For unbalanced designs, Type I (sequential) SS depends on order of factors. Use Type II or III for unbalanced data.
# Type III sums of squares
from statsmodels.stats.anova import anova_lm
anova_lm(model, typ=3)  # Type III
Practical Product Example
Testing a new checkout flow (treatment) across device types:
def analyze_ab_test_with_segments(df, metric, treatment_col, segment_col):
    """
    Analyze A/B test with segment interactions.
    """
    # 1. Overall treatment effect
    control = df[df[treatment_col] == 'control'][metric]
    treatment = df[df[treatment_col] == 'treatment'][metric]
    overall_lift = treatment.mean() - control.mean()

    # 2. Two-way ANOVA for interaction
    model, anova_table = two_way_anova(df, metric, treatment_col, segment_col)

    # 3. Simple effects by segment
    segments = df[segment_col].unique()
    simple_effects = {}
    for seg in segments:
        seg_data = df[df[segment_col] == seg]
        c = seg_data[seg_data[treatment_col] == 'control'][metric]
        t = seg_data[seg_data[treatment_col] == 'treatment'][metric]
        lift = t.mean() - c.mean()
        _, p = stats.ttest_ind(c, t)
        simple_effects[seg] = {'lift': lift, 'p_value': p}

    return {
        'overall_lift': overall_lift,
        'anova_table': anova_table,
        'interaction_p': anova_table.loc[f'C({treatment_col}):C({segment_col})', 'PR(>F)'],
        'simple_effects': simple_effects
    }


result = analyze_ab_test_with_segments(df, 'outcome', 'treatment', 'device')
print(f"Overall lift: {result['overall_lift']:.1f}")
print(f"Interaction p-value: {result['interaction_p']:.4f}")
print("\nSimple effects by device:")
for seg, effects in result['simple_effects'].items():
    print(f"  {seg}: lift = {effects['lift']:.1f}, p = {effects['p_value']:.4f}")
Related Methods
- Comparing More Than Two Groups — The pillar guide
- Interaction Terms in Regression — Regression perspective
- Controlling Covariates: ANCOVA vs. Regression — Adding continuous covariates
Key Takeaway
Two-way ANOVA and regression are mathematically equivalent for categorical factors. The key insight is interactions: when the effect of one factor depends on another, interpreting main effects alone is misleading. Always test interactions before interpreting main effects, and visualize with interaction plots.
References
- https://www.jstor.org/stable/2683903
- https://psycnet.apa.org/record/1980-25720-001
- Maxwell, S. E., & Delaney, H. D. (2004). *Designing Experiments and Analyzing Data* (2nd ed.). Lawrence Erlbaum Associates.
- Cohen, J., Cohen, P., West, S. G., & Aiken, L. S. (2003). *Applied Multiple Regression/Correlation Analysis for the Behavioral Sciences* (3rd ed.). Routledge.
- Kutner, M. H., Nachtsheim, C. J., Neter, J., & Li, W. (2005). *Applied Linear Statistical Models* (5th ed.). McGraw-Hill.
Frequently Asked Questions
When should I use two-way ANOVA vs. regression?
What does an interaction mean in practical terms?
Should I always test for interactions?
Key Takeaway
Two-way ANOVA and regression are mathematically equivalent for categorical factors. The key insight is interactions: when the effect of one factor depends on another, interpreting main effects alone is misleading. Always test interactions before interpreting main effects.