Contents
Testing Trends Across Ordered Groups: Jonckheere-Terpstra and Alternatives
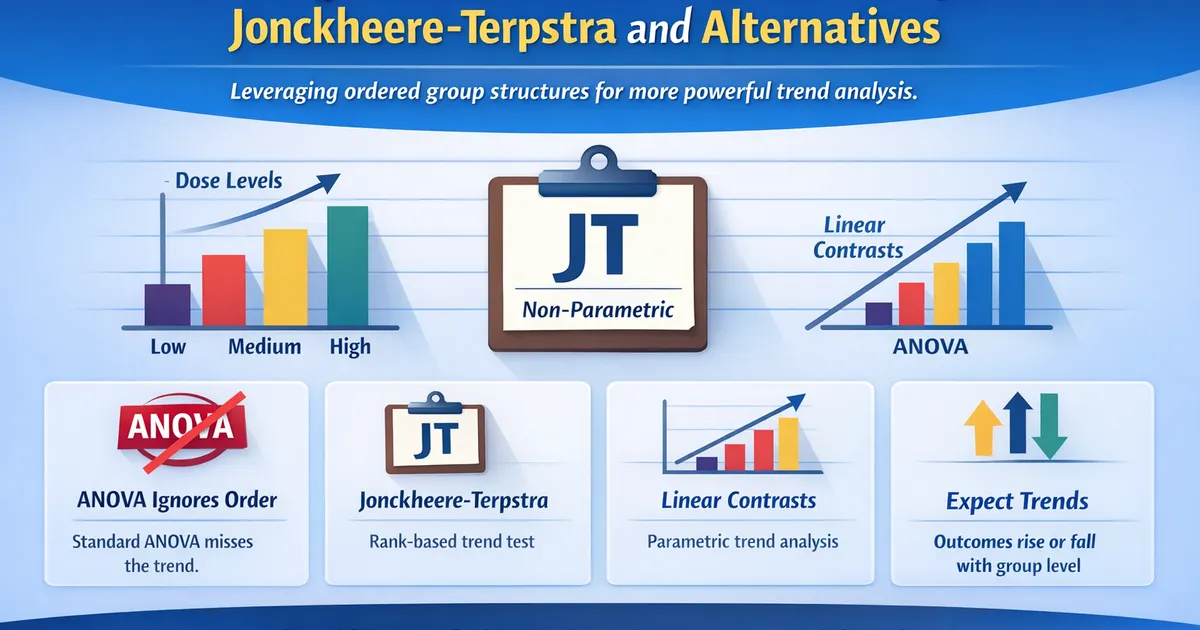
When your groups have a natural order (dose levels, experience tiers, usage intensity), standard ANOVA ignores this structure. Learn about trend tests that leverage ordering for more power.
Quick Hits
- •Standard ANOVA ignores group ordering—trend tests use this information for more power
- •Jonckheere-Terpstra is a non-parametric trend test based on ranks
- •Linear contrasts in ANOVA test for monotonic trends parametrically
- •Use trend tests when you expect outcomes to increase (or decrease) with group level
TL;DR
When groups have a natural ordering (low/medium/high, dose levels, experience tiers), standard ANOVA ignores this structure. Trend tests leverage the ordering to detect monotonic patterns more powerfully. Jonckheere-Terpstra is the non-parametric choice; linear contrasts work within ANOVA. Both are more powerful than standard ANOVA when a trend actually exists.
The Problem with Standard ANOVA
ANOVA tests whether any group differs from any other—it treats "Low" vs "High" the same as "Low" vs "Medium." This ignores valuable information.
import numpy as np
from scipy import stats

# Example: Response to increasing dose levels
np.random.seed(42)
placebo = np.random.normal(50, 10, 30)
low_dose = np.random.normal(52, 10, 30)
medium_dose = np.random.normal(55, 10, 30)
high_dose = np.random.normal(58, 10, 30)

# Standard ANOVA
f_stat, p_anova = stats.f_oneway(placebo, low_dose, medium_dose, high_dose)
print(f"Standard ANOVA: F = {f_stat:.2f}, p = {p_anova:.4f}")

# ANOVA might not be significant because it tests for "any difference"
# But there's a clear increasing trend!
Jonckheere-Terpstra Test
A non-parametric test for ordered alternatives. Tests whether there's a tendency for values to increase (or decrease) across ordered groups.
How It Works
- For each pair of groups (i < j), count how many times an observation in group j exceeds an observation in group i
- Sum these counts
- Large sums indicate an increasing trend
Python Implementation
from scipy.stats import mannwhitneyu
import numpy as np

def jonckheere_terpstra(groups, alternative='increasing'):
    """
    Jonckheere-Terpstra test for ordered alternatives.

    groups: list of arrays in order (lowest to highest expected values)
    alternative: 'increasing', 'decreasing', or 'two-sided'
    """
    k = len(groups)
    n_total = sum(len(g) for g in groups)

    # Calculate J statistic: sum of Mann-Whitney U for all ordered pairs
    J = 0
    for i in range(k - 1):
        for j in range(i + 1, k):
            # Count pairs where group j > group i
            for x in groups[i]:
                for y in groups[j]:
                    if y > x:
                        J += 1
                    elif y == x:
                        J += 0.5

    # Expected value and variance under null
    ns = [len(g) for g in groups]
    N = sum(ns)

    E_J = (N**2 - sum(n**2 for n in ns)) / 4

    # Variance (simplified formula)
    var_J = (N**2 * (2*N + 3) - sum(n**2 * (2*n + 3) for n in ns)) / 72

    # Z-score
    z = (J - E_J) / np.sqrt(var_J)

    # P-value
    if alternative == 'increasing':
        p_value = 1 - stats.norm.cdf(z)
    elif alternative == 'decreasing':
        p_value = stats.norm.cdf(z)
    else:  # two-sided
        p_value = 2 * (1 - stats.norm.cdf(abs(z)))

    return {
        'J_statistic': J,
        'z_score': z,
        'p_value': p_value
    }


# Test for increasing trend
result = jonckheere_terpstra([placebo, low_dose, medium_dose, high_dose],
                             alternative='increasing')
print(f"\nJonckheere-Terpstra test:")
print(f"  J = {result['J_statistic']:.0f}")
print(f"  z = {result['z_score']:.2f}")
print(f"  p = {result['p_value']:.4f}")
Using scipy (if available)
# scipy.stats doesn't have J-T built in, but you can use:
# pip install scikit-posthocs
import scikit_posthocs as sp

# Create dataframe
import pandas as pd
all_data = np.concatenate([placebo, low_dose, medium_dose, high_dose])
groups = np.repeat([1, 2, 3, 4], 30)
df = pd.DataFrame({'value': all_data, 'group': groups})

# Note: scikit_posthocs may have Jonckheere-Terpstra
R Implementation
library(clinfun)
jonckheere.test(value, group, alternative = "increasing")

# Or using PMCMRplus
library(PMCMRplus)
jonckheereTest(value ~ group, data = df, alternative = "greater")
Linear Contrast in ANOVA
A parametric alternative: test whether there's a linear relationship between group codes and outcomes.
How It Works
Assign numeric codes to ordered groups (e.g., 1, 2, 3, 4) and test whether the regression of outcome on these codes is significant.
import statsmodels.api as sm

def linear_contrast_test(groups, codes=None):
    """
    Test for linear trend using contrast coding.

    groups: list of arrays in order
    codes: optional linear codes (default: 1, 2, 3, ...)
    """
    k = len(groups)
    if codes is None:
        codes = list(range(1, k + 1))

    # Create data
    all_data = np.concatenate(groups)
    all_codes = np.repeat(codes, [len(g) for g in groups])

    # Regression
    X = sm.add_constant(all_codes)
    model = sm.OLS(all_data, X).fit()

    return {
        'slope': model.params[1],
        'se': model.bse[1],
        't_statistic': model.tvalues[1],
        'p_value': model.pvalues[1],
        'r_squared': model.rsquared
    }


result = linear_contrast_test([placebo, low_dose, medium_dose, high_dose])
print(f"\nLinear Contrast Test:")
print(f"  Slope = {result['slope']:.2f} per unit increase")
print(f"  t = {result['t_statistic']:.2f}")
print(f"  p = {result['p_value']:.4f}")
print(f"  R² = {result['r_squared']:.3f}")
R Implementation
# Linear contrast in ANOVA
# Assign orthogonal polynomial contrasts
contrasts(df$group) <- contr.poly(4)
model <- aov(value ~ group, data = df)
summary.lm(model)  # Linear trend is the .L coefficient
Comparing Methods
def compare_trend_tests(groups):
    """Compare standard ANOVA, J-T, and linear contrast."""
    print("Method Comparison for Ordered Groups:")
    print("=" * 50)

    # Standard ANOVA
    f_stat, p_anova = stats.f_oneway(*groups)
    print(f"Standard ANOVA: F = {f_stat:.2f}, p = {p_anova:.4f}")

    # Jonckheere-Terpstra
    jt = jonckheere_terpstra(groups, alternative='increasing')
    print(f"Jonckheere-Terpstra: z = {jt['z_score']:.2f}, p = {jt['p_value']:.4f}")

    # Linear contrast
    lc = linear_contrast_test(groups)
    print(f"Linear Contrast: t = {lc['t_statistic']:.2f}, p = {lc['p_value']:.4f}")


compare_trend_tests([placebo, low_dose, medium_dose, high_dose])
Power Comparison
When a linear trend exists, trend tests are more powerful:
def simulate_power(n_per_group=30, effect_per_step=2, sd=10, n_sims=1000):
    """Compare power of different tests for trend detection."""
    anova_sig = 0
    jt_sig = 0
    linear_sig = 0

    for _ in range(n_sims):
        # Generate data with linear trend
        g1 = np.random.normal(50, sd, n_per_group)
        g2 = np.random.normal(50 + effect_per_step, sd, n_per_group)
        g3 = np.random.normal(50 + 2*effect_per_step, sd, n_per_group)
        g4 = np.random.normal(50 + 3*effect_per_step, sd, n_per_group)

        groups = [g1, g2, g3, g4]

        # ANOVA
        _, p = stats.f_oneway(*groups)
        if p < 0.05:
            anova_sig += 1

        # J-T
        jt = jonckheere_terpstra(groups, 'increasing')
        if jt['p_value'] < 0.05:
            jt_sig += 1

        # Linear contrast
        lc = linear_contrast_test(groups)
        if lc['p_value'] < 0.05:
            linear_sig += 1

    return {
        'ANOVA_power': anova_sig / n_sims,
        'JT_power': jt_sig / n_sims,
        'Linear_power': linear_sig / n_sims
    }


power = simulate_power()
print("\nPower to detect linear trend:")
for method, pwr in power.items():
    print(f"  {method}: {pwr:.1%}")
When to Use Which
| Situation | Recommended Test |
|---|---|
| Ordered groups, expect linear trend | Linear contrast |
| Ordered groups, any monotonic trend | Jonckheere-Terpstra |
| Non-normal data, ordered groups | Jonckheere-Terpstra |
| No expected ordering | Standard ANOVA |
| Non-monotonic pattern possible | Standard ANOVA |
| Confirmatory dose-response | Linear or polynomial contrast |
Practical Example: User Experience Tiers
# User engagement by experience level
np.random.seed(42)
new_users = np.random.normal(5, 2, 100)      # 0-30 days
regular_users = np.random.normal(7, 2, 100)   # 31-90 days
power_users = np.random.normal(10, 2, 100)    # 91-180 days
veterans = np.random.normal(12, 2, 100)       # 180+ days

print("Engagement by Experience Tier:")
print(f"  New users: M = {new_users.mean():.1f}")
print(f"  Regular users: M = {regular_users.mean():.1f}")
print(f"  Power users: M = {power_users.mean():.1f}")
print(f"  Veterans: M = {veterans.mean():.1f}")

# Test for increasing trend
groups = [new_users, regular_users, power_users, veterans]

jt = jonckheere_terpstra(groups, 'increasing')
print(f"\nTrend test: z = {jt['z_score']:.2f}, p = {jt['p_value']:.4f}")

lc = linear_contrast_test(groups)
print(f"Engagement increases by {lc['slope']:.1f} units per tier")
Effect Size for Trends
def trend_effect_size(groups):
    """
    Calculate effect size for trend (standardized slope).
    """
    codes = list(range(1, len(groups) + 1))
    all_data = np.concatenate(groups)
    all_codes = np.repeat(codes, [len(g) for g in groups])

    # Correlation between codes and values
    r = np.corrcoef(all_codes, all_data)[0, 1]

    # Standardized slope
    std_slope = r * (np.std(all_data) / np.std(all_codes))

    return {
        'correlation': r,
        'r_squared': r**2,
        'standardized_slope': std_slope
    }


effect = trend_effect_size([placebo, low_dose, medium_dose, high_dose])
print(f"\nTrend effect size:")
print(f"  r = {effect['correlation']:.3f}")
print(f"  R² = {effect['r_squared']:.3f}")
Related Methods
- Comparing More Than Two Groups — The pillar guide
- One-Way ANOVA — When groups aren't ordered
- Kruskal-Wallis — Non-parametric without ordering
Key Takeaway
When comparing ordered groups (dose levels, experience tiers, usage intensity), trend tests like Jonckheere-Terpstra or linear contrasts are more powerful than standard ANOVA because they use the ordering information. Use them when you expect outcomes to increase or decrease systematically across groups.
References
- https://www.jstor.org/stable/2332611
- https://www.jstor.org/stable/2333011
- Jonckheere, A. R. (1954). A distribution-free k-sample test against ordered alternatives. *Biometrika*, 41(1/2), 133-145.
- Terpstra, T. J. (1952). The asymptotic normality and consistency of Kendall's test against trend, when ties are present in one ranking. *Indagationes Mathematicae*, 14(3), 327-333.
- Cuzick, J. (1985). A Wilcoxon-type test for trend. *Statistics in Medicine*, 4(4), 543-547.
Frequently Asked Questions
When should I use a trend test instead of ANOVA?
Does Jonckheere-Terpstra require normality?
What if the trend isn't linear?
Key Takeaway
When comparing ordered groups (dose levels, experience tiers, usage intensity), trend tests like Jonckheere-Terpstra or linear contrasts are more powerful than standard ANOVA because they use the ordering information. Use them when you expect outcomes to increase or decrease systematically across groups.