Contents
Statistically Significant but Meaningless: Practical Thresholds for Evals
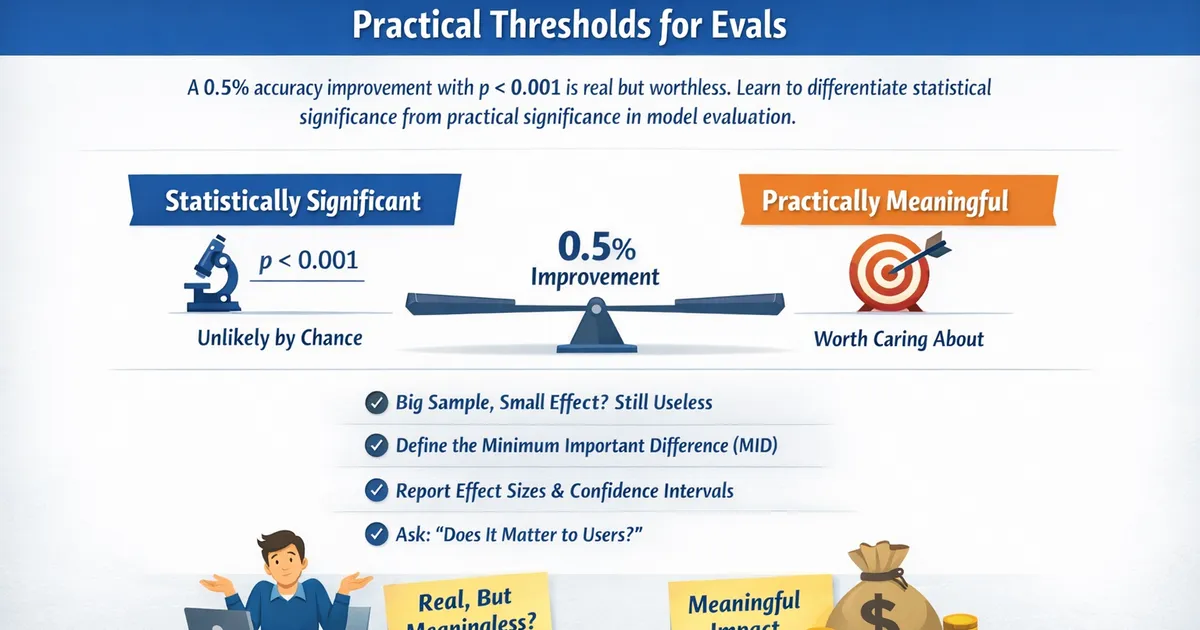
A 0.5% accuracy improvement with p<0.001 is real but worthless. Learn how to distinguish statistically significant from practically meaningful in model evaluation.
Quick Hits
- •Statistical significance = unlikely due to chance. Practical significance = worth caring about.
- •With large eval sets, tiny differences become significant but remain meaningless
- •Define minimum important difference (MID) before evaluation, not after
- •Report effect sizes and confidence intervals, not just p-values
- •Ask: 'Would users notice?' and 'Does the cost-benefit make sense?'
TL;DR
Statistical significance means an effect is unlikely due to chance. Practical significance means it matters. With large evaluation sets, even tiny model improvements become statistically significant. The solution: pre-define your minimum important difference (MID), report effect sizes and confidence intervals (not just p-values), and ask whether the improvement justifies the costs. A 0.5% accuracy gain with is real but probably not worth deploying.
The Problem
Scenario
You evaluate your new model on 50,000 examples:
- Accuracy improves from 87.2% to 87.5%
- This 0.3% improvement has
Questions:
- Is this improvement real? Yes (highly significant)
- Is this improvement meaningful? Probably not
Why This Happens
Sample size drives p-values:
As n increases:
- SE decreases
- Smaller effects become detectable
- Eventually, any non-zero effect becomes significant
import numpy as np
from scipy import stats


def demonstrate_significance_vs_effect():
    """
    Show how significance depends on sample size, not effect size.
    """
    np.random.seed(42)
    effect_size = 0.003  # 0.3% accuracy difference

    results = []
    for n in [1000, 5000, 10000, 50000, 100000]:
        # Simulate many trials
        significant_count = 0
        for _ in range(500):
            # Model A accuracy ~ 87.2%
            acc_a = np.random.binomial(n, 0.872) / n

            # Model B accuracy ~ 87.5%
            acc_b = np.random.binomial(n, 0.872 + effect_size) / n

            # Z-test for difference
            pooled_p = (acc_a + acc_b) / 2
            se = np.sqrt(pooled_p * (1 - pooled_p) * 2 / n)
            z = (acc_b - acc_a) / se
            p_value = 2 * (1 - stats.norm.cdf(abs(z)))

            if p_value < 0.05:
                significant_count += 1

        results.append({
            'n': n,
            'power': significant_count / 500,
            'effect': effect_size
        })

    print("Statistical Significance vs Sample Size")
    print("(Effect size = 0.3% accuracy difference)")
    print("=" * 50)
    print(f"{'Sample Size':>15} {'Power (% significant)':>25}")
    print("-" * 50)
    for r in results:
        print(f"{r['n']:>15,} {r['power']:>25.1%}")

    print("\nSame tiny effect becomes 'significant' with enough data")


demonstrate_significance_vs_effect()
Statistical vs. Practical Significance
Definitions
| Concept | Meaning | Measured By |
|---|---|---|
| Statistical significance | Effect unlikely due to chance | p-value < |
| Practical significance | Effect is meaningful/useful | Effect size, business impact |
The Matrix
| Practically Significant | Practically Insignificant | |
|---|---|---|
| Statistically Significant | Ship it ✓ | Real but useless |
| Not Significant | Might be useful, underpowered | Nothing to see |
What Each Quadrant Means
- Sig + Practical: Clear win—effect is real and matters
- Sig + Not Practical: Large sample detected tiny effect
- Not Sig + Practical: Underpowered—need more data
- Not Sig + Not Practical: No evidence of meaningful effect
Minimum Important Difference (MID)
Defining Your Threshold
Before evaluation, answer: "What's the smallest improvement worth caring about?"
def define_mid(domain, costs, current_performance):
    """
    Framework for defining minimum important difference.
    """
    considerations = {
        'user_perceptible': "Would users notice this improvement?",
        'business_impact': "How much revenue/cost does 1% improvement represent?",
        'deployment_cost': "What's the cost of deploying the new model?",
        'risk': "What are the risks if the new model has hidden problems?",
        'opportunity_cost': "What else could we work on instead?"
    }

    # Example thresholds by domain
    example_mids = {
        'content_moderation': 0.005,  # 0.5% - safety critical
        'recommendation': 0.02,        # 2% - competitive advantage
        'search_ranking': 0.01,        # 1% - user experience
        'spam_detection': 0.01,        # 1% - user experience
        'llm_quality': 0.03,           # 3% win rate improvement
    }

    return {
        'considerations': considerations,
        'example_thresholds': example_mids
    }
Key considerations when defining your MID:
- Would users notice this improvement?
- How much revenue/cost does a 1% improvement represent?
- What's the cost of deploying the new model?
- What are the risks if the new model has hidden problems?
- What else could we work on instead?
Example MIDs by domain:
- Content moderation: 0.5% — safety-critical
- Recommendation: 2% — competitive advantage
- Search ranking: 1% — user experience
- Spam detection: 1% — user experience
- LLM quality: 3% win rate improvement
MID in Practice
def evaluate_with_mid(acc_new, acc_baseline, n_examples, mid=0.02, alpha=0.05):
    """
    Evaluate improvement considering both statistical and practical significance.
    """
    diff = acc_new - acc_baseline

    # Statistical test
    pooled_p = (acc_new + acc_baseline) / 2
    se = np.sqrt(pooled_p * (1 - pooled_p) * 2 / n_examples)
    z = diff / se
    p_value = 2 * (1 - stats.norm.cdf(abs(z)))

    # Confidence interval
    ci_lower = diff - 1.96 * se
    ci_upper = diff + 1.96 * se

    # Classification
    statistically_significant = p_value < alpha and diff > 0
    practically_significant = diff >= mid
    ci_exceeds_mid = ci_lower >= mid

    if ci_exceeds_mid:
        conclusion = "Clear improvement (CI entirely above MID)"
        action = "Strong evidence to deploy"
    elif practically_significant and statistically_significant:
        conclusion = "Likely improvement (point estimate above MID, significant)"
        action = "Consider deploying, but CI includes below-MID values"
    elif statistically_significant and not practically_significant:
        conclusion = "Detectable but small improvement"
        action = "Real effect but probably not worth deployment cost"
    elif practically_significant and not statistically_significant:
        conclusion = "Potentially meaningful but uncertain"
        action = "Collect more data"
    else:
        conclusion = "No meaningful improvement detected"
        action = "Do not deploy"

    return {
        'difference': diff,
        'ci': (ci_lower, ci_upper),
        'p_value': p_value,
        'mid': mid,
        'statistically_significant': statistically_significant,
        'practically_significant': practically_significant,
        'conclusion': conclusion,
        'action': action
    }


# Example evaluations
print("Evaluation with MID = 2%")
print("=" * 60)

scenarios = [
    ("Tiny effect, huge n", 0.875, 0.872, 100000),
    ("Moderate effect, moderate n", 0.90, 0.87, 5000),
    ("Large effect, small n", 0.92, 0.87, 500),
    ("At MID, moderate n", 0.89, 0.87, 5000),
]

for name, new, base, n in scenarios:
    result = evaluate_with_mid(new, base, n)
    print(f"\n{name}:")
    print(f"  Accuracy: {base:.1%} → {new:.1%} (Δ = {result['difference']:+.1%})")
    print(f"  95% CI: ({result['ci'][0]:+.1%}, {result['ci'][1]:+.1%})")
    print(f"  p-value: {result['p_value']:.4f}")
    print(f"  Statistical sig: {result['statistically_significant']}")
    print(f"  Practical sig (≥MID): {result['practically_significant']}")
    print(f"  → {result['conclusion']}")
    print(f"  → Action: {result['action']}")
Reporting Framework
What to Report
- Effect size (the actual difference)
- Confidence interval (range of plausible effects)
- p-value (evidence against null)
- Pre-specified MID (threshold for caring)
- Interpretation (combining all of the above)
Template
## Results

### Primary Metric: Accuracy
- Baseline: 87.2%
- New Model: 87.8%
- **Difference: +0.6%** (95% CI: +0.3% to +0.9%)
- p-value: 0.001
- Pre-specified MID: 1.0%

### Interpretation
The improvement is statistically significant (p = 0.001) but the
confidence interval (0.3% to 0.9%) falls entirely below our
pre-specified minimum important difference of 1.0%.

**Conclusion**: While we can be confident the new model is slightly
better, the improvement is smaller than what we defined as
practically meaningful.

**Recommendation**: Do not deploy based on accuracy alone.
Consider other factors (latency, cost, secondary metrics) or
wait for evidence of larger improvements.
Calibrating Expectations
Cohen's Benchmarks for Effect Sizes
| Effect Size | Cohen's d | Interpretation |
|---|---|---|
| Small | 0.2 | Barely noticeable |
| Medium | 0.5 | Noticeable |
| Large | 0.8 | Obvious |
But these are general—calibrate to your domain.
Domain-Specific Calibration
def calibrate_expectations(historical_improvements, new_improvement):
    """
    Compare new improvement to historical distribution.
    """
    historical = np.array(historical_improvements)

    percentile = np.mean(historical <= new_improvement) * 100

    return {
        'new_improvement': new_improvement,
        'historical_mean': np.mean(historical),
        'historical_median': np.median(historical),
        'historical_std': np.std(historical),
        'percentile': percentile,
        'interpretation': f"This improvement is larger than {percentile:.0f}% of historical improvements"
    }


# Example: Your team's historical model improvements
historical = [0.005, 0.012, 0.008, 0.025, 0.003, 0.015, 0.007, 0.02, 0.001, 0.018]
new = 0.015

calibration = calibrate_expectations(historical, new)
print("Calibration Against Historical Improvements")
print("=" * 50)
print(f"Historical: mean={calibration['historical_mean']:.1%}, "
      f"median={calibration['historical_median']:.1%}")
print(f"New improvement: {calibration['new_improvement']:.1%}")
print(f"Percentile: {calibration['percentile']:.0f}th")
print(f"→ {calibration['interpretation']}")
Decision Framework
EVALUATION COMPLETE
       ↓
QUESTION: Is the effect statistically significant?
├── No → Insufficient evidence (need more data or no effect)
└── Yes → Continue
       ↓
QUESTION: Does CI exceed your MID?
├── Yes → Clear practical significance, deploy
└── No → Continue
       ↓
QUESTION: Does point estimate exceed MID?
├── Yes → Probable practical significance, consider deployment
└── No → Continue
       ↓
QUESTION: Is the effect size close to MID?
├── Yes → Borderline, consider costs/benefits carefully
└── No → Statistically real but practically small
       ↓
DECISION:
- Factor in deployment costs
- Consider secondary metrics
- Evaluate risks of new model
- Make explicit cost-benefit judgment
Common Mistakes
Mistake 1: Confusing the Two Significances
Wrong: " means we should ship" Right: " means the effect is real; we still need to judge if it's useful"
Mistake 2: Post-Hoc MID Definition
Wrong: "The improvement was 1.5%, which is definitely meaningful" Right: Pre-specify MID before evaluation
Mistake 3: Ignoring Confidence Intervals
Wrong: "Model improved by 2%" Right: "Model improved by 2% (95% CI: 0.5% to 3.5%)"
Mistake 4: Binary Thinking
Wrong: " means significant, means not" Right: Report exact p-values and let readers interpret
R Implementation
# Evaluate with MID
evaluate_with_mid <- function(acc_new, acc_base, n, mid = 0.02, alpha = 0.05) {
    diff <- acc_new - acc_base
    pooled_p <- (acc_new + acc_base) / 2
    se <- sqrt(pooled_p * (1 - pooled_p) * 2 / n)

    z <- diff / se
    p_value <- 2 * pnorm(-abs(z))

    ci <- c(diff - 1.96 * se, diff + 1.96 * se)

    list(
        difference = diff,
        ci = ci,
        p_value = p_value,
        stat_sig = p_value < alpha & diff > 0,
        practical_sig = diff >= mid,
        ci_exceeds_mid = ci[1] >= mid
    )
}
Related Methods
- Model Evaluation (Pillar) - Complete framework
- P-value vs. Confidence Interval - Interpretation guide
- Practical Significance Thresholds - Setting thresholds
- Effect Sizes for Proportions - Measuring magnitude
Key Takeaway
Statistical significance tells you an effect is real; practical significance tells you it matters. With large evaluation sets, even tiny improvements become statistically significant—a 0.3% accuracy gain with is undeniably real but probably not worth deploying. Pre-specify your minimum important difference before evaluation, report confidence intervals so readers can judge both types of significance, and make explicit cost-benefit judgments. The question isn't just "is this improvement real?" but "is this improvement worth acting on?"
References
- https://doi.org/10.1177/2515245918770963
- https://www.jstor.org/stable/3001666
- https://arxiv.org/abs/1903.06372
- Wasserstein, R. L., & Lazar, N. A. (2016). The ASA statement on p-values: Context, process, and purpose. *The American Statistician*, 70(2), 129-133.
- Cohen, J. (1988). *Statistical Power Analysis for the Behavioral Sciences* (2nd ed.). Lawrence Erlbaum.
- Kelley, K., & Preacher, K. J. (2012). On effect size. *Psychological Methods*, 17(2), 137-152.
Frequently Asked Questions
What's a good threshold for 'meaningful' improvement?
My p-value is tiny but the effect is small—what do I do?
How do I determine what effect size is meaningful?
Key Takeaway
Statistical significance tells you an effect is real (not chance); practical significance tells you it matters. With large evaluation sets, even tiny improvements become statistically significant. Pre-specify your minimum important difference: the smallest effect worth caring about. Report confidence intervals so readers can judge both statistical and practical significance. A 0.5% improvement with p<0.001 is undeniably real—but it might also be undeniably unimportant.