Contents
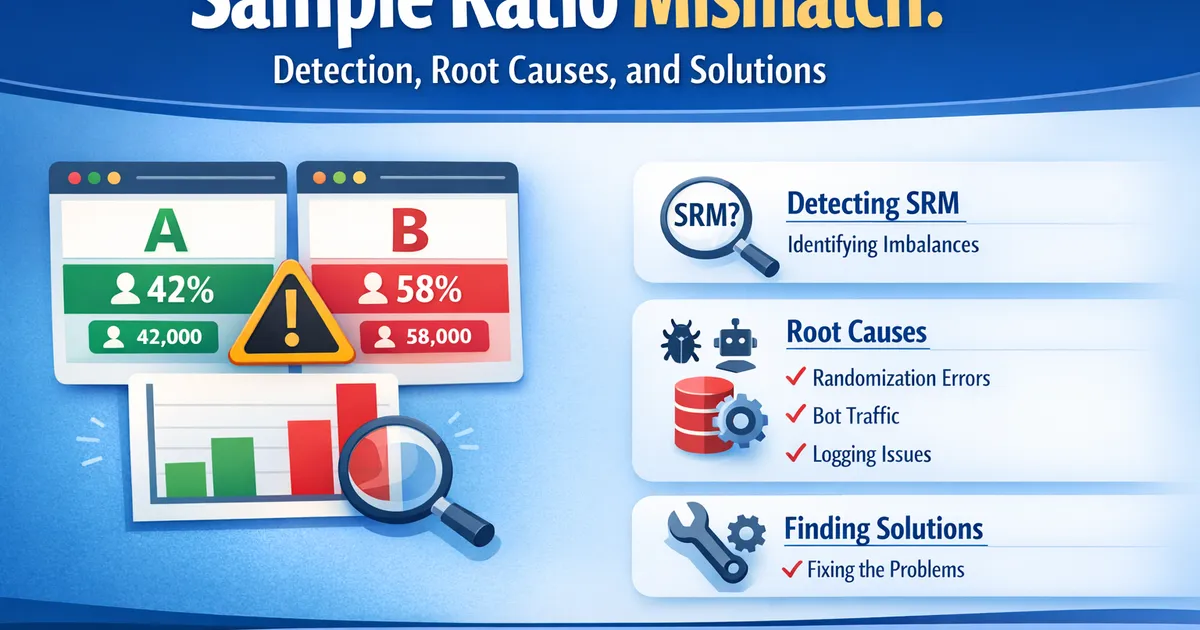
Sample Ratio Mismatch: Detection, Root Causes, and Solutions
How to detect sample ratio mismatch (SRM) in A/B tests, understand its common causes, and what to do when your experiment groups have unexpected sizes.
Quick Hits
- •SRM is the canary in the coal mine—it tells you something is wrong before you misinterpret results
- •Even a 1-2% ratio mismatch can invalidate your experiment
- •The most common causes are bugs in randomization, differential logging, and bot traffic
- •Never try to statistically 'correct' for SRM—find and fix the root cause instead
TL;DR
Sample Ratio Mismatch (SRM) occurs when the observed split between experiment groups differs significantly from the expected split. A 50/50 experiment showing 52/48 is a problem. SRM means something is systematically biased in your randomization, logging, or user experience—and any "results" from that experiment are unreliable. Always check for SRM before interpreting results.
What Is Sample Ratio Mismatch?
In a properly randomized experiment, if you assign 50% of users to control and 50% to treatment, you should observe approximately 50% in each group. Random variation means you won't hit exactly 50/50, but the deviation should be explainable by chance.
SRM occurs when the observed ratio is statistically incompatible with the expected ratio. If you expected 50/50 but observed 52/48 with 100,000 users, that deviation is far too large to be random chance.
Why It Matters
SRM indicates a systematic problem. Users in control and treatment are no longer comparable—they differ in some way beyond just the treatment. Any observed effect might be entirely due to this selection bias, not your change.
Examples:
- Treatment has more bots → inflates treatment conversions (bots don't convert)
- Control has slower page loads → users drop off before being logged → control appears smaller but higher converting
- Randomization bug assigns power users to treatment → treatment looks better regardless of change
Detecting SRM
The Chi-Square Test
Use a chi-square goodness-of-fit test to compare observed counts to expected counts:
from scipy.stats import chisquare
import numpy as np

def check_srm(observed_control, observed_treatment, expected_ratio=0.5):
    """
    Test for Sample Ratio Mismatch.

    Args:
        observed_control: Number of users in control
        observed_treatment: Number of users in treatment
        expected_ratio: Expected proportion in control (default 0.5)

    Returns:
        dict with SRM status, p-value, and observed ratio
    """
    total = observed_control + observed_treatment
    expected_control = total * expected_ratio
    expected_treatment = total * (1 - expected_ratio)

    observed = [observed_control, observed_treatment]
    expected = [expected_control, expected_treatment]

    stat, p_value = chisquare(observed, expected)

    observed_ratio = observed_control / total

    return {
        'has_srm': p_value < 0.001,  # Use stricter threshold
        'p_value': p_value,
        'observed_ratio': observed_ratio,
        'expected_ratio': expected_ratio,
        'chi_square': stat
    }


# Example: Expected 50/50, observed 51,500 control / 48,500 treatment
result = check_srm(51500, 48500, expected_ratio=0.5)
print(f"SRM detected: {result['has_srm']}")
print(f"P-value: {result['p_value']:.2e}")
print(f"Observed ratio: {result['observed_ratio']:.2%}")
R Implementation
check_srm <- function(obs_control, obs_treatment, expected_ratio = 0.5) {
  total <- obs_control + obs_treatment
  expected <- c(total * expected_ratio, total * (1 - expected_ratio))
  observed <- c(obs_control, obs_treatment)

  test <- chisq.test(observed, p = c(expected_ratio, 1 - expected_ratio))

  list(
    has_srm = test$p.value < 0.001,
    p_value = test$p.value,
    observed_ratio = obs_control / total
  )
}

# Example
result <- check_srm(51500, 48500)
print(result)
Threshold for Concern
Use rather than . Because you're checking SRM routinely (every experiment), a 5% threshold would flag too many false alarms. The stricter threshold reduces false positives while still catching meaningful problems.
Common Causes of SRM
1. Randomization Bugs
Cause: The randomization code itself has a bug—perhaps a hash function that doesn't distribute evenly, or conditional logic that biases assignment.
Symptoms: Consistent SRM across all experiments using the same randomization system.
Fix: Audit randomization code. Run A/A tests to verify distribution.
# Example A/A test to verify randomization
def verify_randomization(user_ids, hash_function, n_simulations=100):
    """Run A/A simulation to check for randomization bias."""
    control_counts = []

    for seed in range(n_simulations):
        control = sum(1 for uid in user_ids
                     if hash_function(uid, seed) % 2 == 0)
        control_counts.append(control / len(user_ids))

    mean_ratio = np.mean(control_counts)
    std_ratio = np.std(control_counts)

    print(f"Mean control ratio: {mean_ratio:.4f} (should be ~0.5)")
    print(f"Std of ratio: {std_ratio:.4f}")
2. Redirect Latency / Differential Loading
Cause: Treatment requires a redirect or additional loading time. Some users navigate away before the experience loads.
Symptoms: Treatment group is smaller. Higher-intent or faster-connection users are overrepresented in treatment.
Fix: Ensure assignment happens as early as possible, ideally server-side before page render. Measure time-to-assignment.
3. Bot Traffic
Cause: Bots trigger randomization differently across variants—perhaps treatment has a new element that bots don't interact with, or bot detection fires at different rates.
Symptoms: SRM appears when including all traffic, resolves when excluding bots.
Fix: Improve bot detection. Run experiments on bot-filtered traffic. Check if bot rates differ by variant.
4. Browser Caching
Cause: Cached content serves stale experiences. Users in one variant might get cached pages from another variant's assignment.
Symptoms: SRM that varies by browser type or returning vs. new users.
Fix: Ensure experiment assignment is not cached, or cache is properly invalidated on assignment change.
5. Instrumentation / Logging Bugs
Cause: The assignment happens correctly, but logging fails differentially. Treatment might have new code that delays or blocks event logging.
Symptoms: SRM in logged data but not in actual assignment counts (if you can access those separately).
Fix: Audit logging pipelines. Ensure logging happens at assignment time, not later in the experience.
6. Trigger Timing Issues
Cause: Experiment triggers on some user action, but treatment affects whether/when that action occurs.
Symptoms: SRM with specific trigger conditions.
Fix: Use intent-to-treat assignment. Randomize all potentially eligible users, not just those who complete the triggering action.
7. Partial Exposure / Gradual Rollout
Cause: Treatment was ramped from 0% to 50% over time, but analysis treats all time periods equally.
Symptoms: SRM that reflects the weighted average of different allocation percentages.
Fix: Either analyze only the stable period, or weight observations by their allocation period.
Diagnosing SRM
When you detect SRM, systematic diagnosis is essential:
Step 1: Confirm the Expected Ratio
Are you sure the expected split is what you think? Check:
- Experiment configuration
- Ramp-up history
- Eligibility criteria that might differ
Step 2: Segment Analysis
Break down the ratio by dimensions to find where SRM concentrates:
def diagnose_srm_by_segment(df, segments=['browser', 'device', 'country']):
    """Check SRM within segments to diagnose root cause."""
    for segment in segments:
        print(f"\n--- SRM by {segment} ---")
        for value, group in df.groupby(segment):
            control = (group['variant'] == 'control').sum()
            treatment = (group['variant'] == 'treatment').sum()
            result = check_srm(control, treatment)

            if result['has_srm']:
                print(f"{value}: PROBLEM - ratio={result['observed_ratio']:.2%}, "
                      f"p={result['p_value']:.2e}")
            else:
                print(f"{value}: OK - ratio={result['observed_ratio']:.2%}")
Common segments to check:
- Browser type
- Device type (mobile/desktop)
- New vs. returning users
- Geographic region
- Date of assignment
- Bot vs. human
Step 3: Time Series Analysis
Plot ratio over time to identify when SRM started:
import pandas as pd
import matplotlib.pyplot as plt

def plot_srm_over_time(df, date_col='assignment_date'):
    """Plot control ratio over time to identify when SRM began."""
    daily = df.groupby(date_col).apply(
        lambda x: (x['variant'] == 'control').mean()
    )

    plt.figure(figsize=(12, 4))
    plt.plot(daily.index, daily.values)
    plt.axhline(y=0.5, color='r', linestyle='--', label='Expected')
    plt.xlabel('Date')
    plt.ylabel('Control Ratio')
    plt.title('Sample Ratio Over Time')
    plt.legend()
    plt.show()
Step 4: Check Logging vs. Assignment
If possible, compare counts at different pipeline stages:
- Assignment system logs
- Client-side event logs
- Analytics system counts
Discrepancies reveal where data is being lost.
What NOT to Do
Don't Ignore It
"It's only 2% off" is not acceptable. Even small SRM indicates a systematic problem that might be larger in specific segments or future experiments.
Don't Statistically Correct
You cannot re-weight or adjust for SRM. The bias is unknown and potentially correlated with your outcome. Any "correction" is speculation.
Don't Cherry-Pick Segments
"SRM goes away if we exclude mobile Safari users" might be diagnosing the cause, or it might be p-hacking. Only exclude segments if you have a clear causal explanation for why that segment's data is corrupted.
Don't Interpret Results
An experiment with SRM has no valid results. The treatment effect estimate is biased by an unknown amount in an unknown direction.
What TO Do
1. Pause Interpretation
Don't ship based on an experiment with SRM. You don't know what the true effect is.
2. Investigate Root Cause
Use the diagnostic steps above. Find the actual reason for the mismatch.
3. Fix the Problem
Address the root cause in your experiment infrastructure.
4. Run a Clean Experiment
Start fresh after fixing. Don't try to salvage data from the compromised experiment.
5. Prevent Future SRM
- Add automated SRM checks to your experiment analysis pipeline
- Run A/A tests regularly to validate randomization
- Monitor SRM in real-time during experiment runtime
Automating SRM Detection
Build SRM checking into your experiment workflow:
class ExperimentAnalysis:
    def __init__(self, control_data, treatment_data, expected_ratio=0.5):
        self.control = control_data
        self.treatment = treatment_data
        self.expected_ratio = expected_ratio

    def check_srm(self):
        """Check for SRM before any other analysis."""
        result = check_srm(
            len(self.control),
            len(self.treatment),
            self.expected_ratio
        )

        if result['has_srm']:
            raise ValueError(
                f"SRM detected! Observed ratio {result['observed_ratio']:.2%} "
                f"vs expected {result['expected_ratio']:.2%}. "
                f"p-value: {result['p_value']:.2e}. "
                f"Analysis cannot proceed until SRM is resolved."
            )

        return True

    def analyze(self):
        """Run full analysis only if SRM check passes."""
        self.check_srm()
        # ... proceed with analysis ...
Related Methods
- A/B Testing Statistical Methods for Product Teams — Complete guide to A/B testing
- Sequential Testing — Monitoring experiments without inflating false positives
- Pre-Analysis Checklist — Complete checklist before analyzing any experiment
Frequently Asked Questions
Q: My SRM is significant but only 0.5% off from expected. Is that really a problem? A: With large samples, even tiny deviations can be significant. Focus on practical significance: is the deviation large enough to materially bias your results? For mission-critical decisions, investigate any significant SRM. For lower-stakes tests, document it and proceed with caution.
Q: Can SRM happen by chance in a properly run experiment? A: At , SRM happens by chance in 0.1% of experiments. If you run 1,000 experiments per year, you'll see ~1 spurious SRM. True SRM (indicating real problems) is far more common.
Q: We found the bug and fixed it. Can we use data from after the fix? A: Possibly, if the fix was clean and you have enough data from the post-fix period. But be careful: users who entered during the buggy period might still be in the post-fix data if they returned. Starting a fresh experiment is safer.
Q: Does SRM affect all metrics equally? A: No. If SRM causes treatment to have more high-intent users, conversion rates will be biased more than metrics that don't correlate with intent. But you can't know which metrics are more or less biased without knowing the exact cause.
Key Takeaway
Sample ratio mismatch is your experiment's check engine light. It tells you something is wrong with the randomization or measurement process. Never ignore it, never try to correct for it statistically—find and fix the root cause, then run a clean experiment. Building automated SRM checks into your analysis pipeline is one of the highest-value investments an experimentation program can make.
References
- https://www.exp-platform.com/Documents/2019-FirstPracticalOnlineControlledExperimentswithSwitchbackDesignsSRM.pdf
- https://arxiv.org/abs/1910.02474
- Kohavi, R., Deng, A., Frasca, B., Walker, T., Xu, Y., & Pohlmann, N. (2013). Online Controlled Experiments at Large Scale. *KDD '13*.
- Fabijan, A., Gupchup, J., Gupta, S., Omhover, J., Qin, W., Vermeer, L., & Dmitriev, P. (2019). Diagnosing Sample Ratio Mismatch in Online Controlled Experiments. *KDD '19*.
- Chen, N., Liu, M., & Xu, Y. (2019). How A/B Tests Could Go Wrong: Automatic Diagnosis of Invalid Online Experiments. *WSDM '19*.
Frequently Asked Questions
How much mismatch is acceptable?
Can I still trust my results if SRM is small?
My SRM disappeared after excluding bots. Is the experiment valid now?
Key Takeaway
Sample ratio mismatch is your experiment's check engine light. It tells you something is wrong with the randomization or measurement process. Never ignore it, never try to correct for it statistically—find and fix the root cause, then run a clean experiment.