Contents
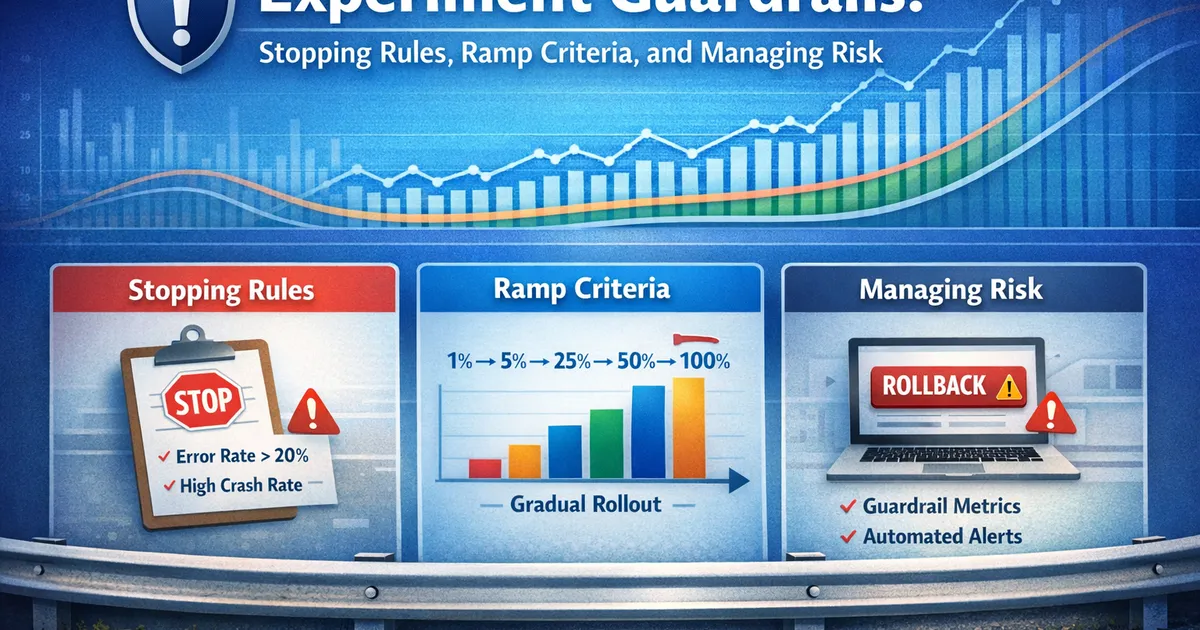
Experiment Guardrails: Stopping Rules, Ramp Criteria, and Managing Risk
Protect your experiments and users with proper guardrails. Learn when to stop an experiment, how to safely ramp exposure, and what metrics should trigger automatic rollback.
Quick Hits
- •Guardrails = metrics that trigger alerts or automatic rollback when violated
- •Define stopping rules before launch: 'Stop if error rate increases >20%'
- •Ramp gradually: 1% → 5% → 25% → 50% → 100%, with checks at each stage
- •Distinguish between 'ship' metrics (must improve) and 'guardrail' metrics (must not regress)
- •Automated monitoring catches problems faster than manual review
TL;DR
Guardrails protect experiments from causing harm: metrics that must not regress (error rates, latency), thresholds that trigger alerts (>10% increase), and automatic rollback rules. Define them before launch. Ramp exposure gradually (1% → 5% → 25% → 50% → 100%) with checks at each stage. When a guardrail fires, investigate immediately—the cost of a false alarm is low; the cost of shipping a broken feature is high.
What Are Guardrails?
Definition
Guardrails = Metrics that must not significantly regress, regardless of primary metric performance.
Primary Metric: "What we want to improve"
  Example: Conversion rate

Guardrail Metrics: "What we must not break"
  Examples: Error rate, latency, crashes, revenue
The Guardrail Mentality
| Without Guardrails | With Guardrails |
|---|---|
| "Conversion up 5%! Ship it!" | "Conversion up 5%, but error rate up 30%. Investigate." |
| Problems discovered post-launch | Problems caught during experiment |
| Reactive incident response | Proactive risk management |
| "Why didn't we catch this?" | "Guardrail triggered—good thing we checked" |
Types of Guardrails
1. Primary Guardrails (Must Monitor)
These should be in every experiment:
- Error rate: Server errors (5xx), client errors. No increase > 10%. Protects user experience and data integrity.
- Latency (p95): 95th percentile page load time. No increase > 15%. Protects user experience and SEO impact.
- Crash rate: App crashes per session. No increase > 5%. Prevents severe user impact.
- Sample ratio: Ratio of users in each variant. SRM test p > 0.001. Ensures data quality and catches randomization bugs.
2. Secondary Guardrails (Context-Dependent)
Add based on your feature:
Checkout flow:
- Payment errors: no increase > 5%
- Abandoned carts: no increase > 10%
- Support tickets: no increase > 20%
- Refund rate: no increase > 5%
Search ranking:
- Zero result rate: no increase > 5%
- Time to first click: no increase > 15%
- Query abandonment: no increase > 10%
Notification:
- Unsubscribe rate: no increase > 10%
- Spam reports: no increase > 5%
- App uninstalls: no increase > 5%
Performance:
- Memory usage: no increase > 10%
- Battery drain: no increase > 10%
- Data usage: no increase > 20%
3. Business Guardrails
Metrics where regression has business consequences:
## Business Guardrails

### Revenue
- **Threshold**: No decrease > 2%
- **When to use**: Features not intended to affect revenue
- **Why**: Even unrelated features can accidentally hurt revenue

### Engagement (DAU/MAU)
- **Threshold**: No decrease > 1%
- **When to use**: Any major user-facing change
- **Why**: Proxy for long-term health

### Retention (Day 7, Day 30)
- **Threshold**: No decrease (within measurement precision)
- **When to use**: Onboarding, core experience changes
- **Why**: Leading indicator of churn
Setting Thresholds
Framework for Threshold Selection
import numpy as np
from scipy import stats


def set_guardrail_threshold(historical_data, sensitivity='medium'):
    """
    Set guardrail threshold based on historical variability.

    Parameters:
    -----------
    historical_data : array
        Historical values of the metric (e.g., daily error rates)
    sensitivity : str
        'high' (tight), 'medium', or 'low' (loose)
    """
    mean = np.mean(historical_data)
    std = np.std(historical_data)

    # Sensitivity multipliers
    multipliers = {
        'high': 1.5,    # Tight: catch small changes, more false alarms
        'medium': 2.5,  # Balanced
        'low': 4.0      # Loose: only catch big changes, fewer false alarms
    }

    multiplier = multipliers.get(sensitivity, 2.5)

    # Threshold as relative increase from mean
    threshold_absolute = mean + multiplier * std
    threshold_relative = (threshold_absolute - mean) / mean * 100

    return {
        'baseline_mean': mean,
        'baseline_std': std,
        'threshold_absolute': threshold_absolute,
        'threshold_relative_pct': threshold_relative,
        'sensitivity': sensitivity
    }


# Example: Error rate over 30 days
historical_error_rate = np.array([
    0.012, 0.011, 0.013, 0.012, 0.014, 0.011, 0.010, 0.013,
    0.012, 0.015, 0.011, 0.012, 0.013, 0.011, 0.012, 0.014,
    0.010, 0.011, 0.012, 0.013, 0.012, 0.011, 0.012, 0.013,
    0.012, 0.011, 0.013, 0.012, 0.011, 0.012
])

for sens in ['high', 'medium', 'low']:
    result = set_guardrail_threshold(historical_error_rate, sens)
    print(f"\n{sens.upper()} Sensitivity:")
    print(f"  Baseline: {result['baseline_mean']:.2%} ± {result['baseline_std']:.2%}")
    print(f"  Threshold: {result['threshold_absolute']:.2%}")
    print(f"  Alert if: >{result['threshold_relative_pct']:.0f}% increase")
Threshold by Metric Type
| Metric Type | Typical Threshold | Rationale |
|---|---|---|
| Error rate | 10-20% increase | Balance sensitivity/noise |
| Latency (P95) | 15-25% increase | Noticeable to users above this |
| Crash rate | 5-10% increase | High impact, tight threshold |
| Revenue | 2-5% decrease | Business critical |
| Conversion | Context-dependent | May be primary metric |
Stopping Rules
When to Stop Immediately
def should_stop_experiment(guardrail_results):
    """
    Determine if experiment should be stopped based on guardrail status.
    """
    stop_reasons = []

    for metric, result in guardrail_results.items():
        # Immediate stop conditions
        if result['status'] == 'violated':
            if result['severity'] == 'critical':
                stop_reasons.append({
                    'action': 'STOP IMMEDIATELY',
                    'metric': metric,
                    'reason': result['reason'],
                    'urgency': 'NOW'
                })
            elif result['severity'] == 'warning':
                stop_reasons.append({
                    'action': 'PAUSE AND INVESTIGATE',
                    'metric': metric,
                    'reason': result['reason'],
                    'urgency': '24 hours'
                })

    if stop_reasons:
        print("⚠️  STOPPING RULES TRIGGERED")
        print("=" * 50)
        for reason in stop_reasons:
            print(f"\n{reason['action']} ({reason['urgency']})")
            print(f"  Metric: {reason['metric']}")
            print(f"  Reason: {reason['reason']}")
    else:
        print("✓ All guardrails passing")

    return stop_reasons


# Example
guardrail_results = {
    'error_rate': {
        'status': 'violated',
        'severity': 'critical',
        'reason': 'Error rate increased 45% (threshold: 20%)'
    },
    'latency_p95': {
        'status': 'ok',
        'severity': None,
        'reason': 'Within threshold'
    },
    'srm': {
        'status': 'violated',
        'severity': 'critical',
        'reason': 'Sample ratio mismatch detected (p < 0.001)'
    }
}

should_stop_experiment(guardrail_results)
Stopping Rule Framework
## Pre-Defined Stopping Rules

### STOP IMMEDIATELY
- SRM detected (p < 0.001)
- Error rate increase > 50%
- Crash rate increase > 25%
- Revenue decrease > 10%
- Any safety-related regression

### PAUSE AND INVESTIGATE (24 hours)
- Error rate increase > 20%
- Latency increase > 30%
- Significant support ticket increase
- Unexplained metric anomalies

### CONTINUE WITH MONITORING
- Error rate increase 10-20% (close to threshold)
- Minor latency increase
- Primary metric not yet significant (expected)

### DO NOT STOP FOR
- Primary metric not significant yet (patience)
- Stakeholder wants early results
- Competitor pressure
- Point estimate is negative but CI includes positive
Ramp Criteria
The Ramp Schedule
Low risk:
| Exposure | Duration | Checks |
|---|---|---|
| 5% | 1 day | Basic |
| 25% | 2 days | Basic, metrics |
| 100% | Ongoing | Full |
Medium risk:
| Exposure | Duration | Checks |
|---|---|---|
| 1% | 1 day | Basic |
| 5% | 2 days | Basic, metrics |
| 25% | 3 days | Full |
| 50% | 3 days | Full |
| 100% | Ongoing | Full |
High risk:
| Exposure | Duration | Checks |
|---|---|---|
| 0.1% | 1 day | Manual |
| 1% | 2 days | Basic, manual |
| 5% | 3 days | Full |
| 10% | 3 days | Full |
| 25% | 5 days | Full |
| 50% | 5 days | Full |
| 100% | Ongoing | Full |
What to Check at Each Stage
## Ramp Check Types

### 'basic' (1% exposure)
- Feature loads without errors
- No obvious bugs in logs
- SRM check passing

### 'metrics' (5-10% exposure)
- Guardrail metrics within bounds
- No anomalous patterns
- SRM still passing

### 'full' (25%+ exposure)
- All guardrail metrics checked with statistical tests
- Primary metric trending as expected (or at least not negative)
- User feedback (if available)
- Support ticket volume

### 'manual' (high-risk features)
- Manual QA of user sessions
- Review of edge cases
- Stakeholder sign-off before next stage
Automated Ramp Decision
def ramp_decision(current_pct, guardrail_results, days_at_current):
    """
    Decide whether to ramp up, hold, or roll back.
    """
    # Count guardrail statuses
    violations = sum(1 for g in guardrail_results.values()
                    if g['status'] == 'violated')
    warnings = sum(1 for g in guardrail_results.values()
                  if g['status'] == 'warning')

    # Decision logic
    if violations > 0:
        return {
            'decision': 'ROLL BACK',
            'reason': f'{violations} guardrail violation(s)',
            'action': 'Reduce to previous stage or 0%'
        }
    elif warnings >= 2:
        return {
            'decision': 'HOLD',
            'reason': f'{warnings} guardrail warnings',
            'action': 'Investigate before proceeding'
        }
    elif days_at_current < 2 and current_pct < 100:
        return {
            'decision': 'HOLD',
            'reason': 'Minimum duration not met',
            'action': f'Wait {2 - days_at_current} more day(s)'
        }
    else:
        return {
            'decision': 'RAMP UP',
            'reason': 'All checks passing',
            'action': 'Proceed to next exposure level'
        }


# Example
decision = ramp_decision(
    current_pct=5,
    guardrail_results={
        'error_rate': {'status': 'ok'},
        'latency': {'status': 'warning'},
        'srm': {'status': 'ok'}
    },
    days_at_current=3
)

print(f"Decision: {decision['decision']}")
print(f"Reason: {decision['reason']}")
print(f"Action: {decision['action']}")
Automated Monitoring
Monitoring System Requirements
Real-time metrics:
- Latency: < 5 min delay
- Errors: < 5 min delay
- Crashes: < 15 min delay
- Update frequency: every 5 minutes
Batch metrics:
- Conversion: daily
- Revenue: daily
- Retention: weekly
- Update frequency: once per day
Alerts:
- Channels: Slack, PagerDuty, Email
- Escalation: auto-page on-call for critical
- Deduplication: alert once per threshold cross
Dashboards:
- Real-time: current guardrail status
- Trends: metric trends over experiment
- Comparison: control vs treatment plots
Alert Configuration
# Example alert configuration

alerts:
  - name: "Error Rate Critical"
    metric: error_rate
    condition: "> baseline * 1.5"  # 50% increase
    severity: critical
    action: "page_oncall"

  - name: "Error Rate Warning"
    metric: error_rate
    condition: "> baseline * 1.2"  # 20% increase
    severity: warning
    action: "slack_channel"

  - name: "SRM Detected"
    metric: sample_ratio_mismatch
    condition: "p_value < 0.001"
    severity: critical
    action: "pause_experiment"

  - name: "Latency Degradation"
    metric: latency_p95
    condition: "> baseline * 1.25"
    severity: warning
    action: "slack_channel"

  - name: "Revenue Drop"
    metric: revenue_per_user
    condition: "< baseline * 0.95"  # 5% decrease
    severity: critical
    action: "page_oncall"
Responding to Guardrail Violations
The Response Playbook
## Guardrail Violation Response Playbook

### Step 1: Verify (5 minutes)
- [ ] Is the alert real or a data glitch?
- [ ] Check metric source for data quality
- [ ] Verify experiment is still running correctly

### Step 2: Assess Severity (5 minutes)
- [ ] How far above threshold?
- [ ] How many users affected?
- [ ] Is it getting worse?

### Step 3: Decide (5 minutes)
- [ ] CRITICAL: Pause experiment immediately
- [ ] WARNING: Continue monitoring, prepare to pause
- [ ] FALSE ALARM: Document and close

### Step 4: Investigate (if paused)
- [ ] Check logs for errors
- [ ] Compare control vs treatment behavior
- [ ] Identify root cause
- [ ] Determine if fixable

### Step 5: Resolve
- [ ] Fix issue and resume, OR
- [ ] Roll back permanently, OR
- [ ] Adjust guardrail if false positive

### Step 6: Document
- [ ] Record what happened
- [ ] Note what you learned
- [ ] Update guardrail thresholds if needed
Common False Positives
| False Positive | How to Identify | Prevention |
|---|---|---|
| Seasonal spike | Affects control too | Compare vs control, not just baseline |
| Data delay | Resolves in minutes | Wait for data freshness |
| Infrastructure issue | Affects all experiments | Cross-experiment correlation |
| Metric calculation bug | Investigation | Validate metric pipeline |
R Implementation
# Function to check guardrails
check_guardrails <- function(
  treatment_metrics,
  control_metrics,
  thresholds
) {
  results <- list()

  for (metric_name in names(thresholds)) {
    treatment_val <- treatment_metrics[[metric_name]]
    control_val <- control_metrics[[metric_name]]
    threshold <- thresholds[[metric_name]]

    # Calculate relative difference
    rel_diff <- (treatment_val - control_val) / control_val * 100

    # Check against threshold
    if (rel_diff > threshold) {
      status <- "VIOLATED"
    } else if (rel_diff > threshold * 0.8) {
      status <- "WARNING"
    } else {
      status <- "OK"
    }

    results[[metric_name]] <- list(
      treatment = treatment_val,
      control = control_val,
      difference_pct = rel_diff,
      threshold_pct = threshold,
      status = status
    )
  }

  return(results)
}

# Example
treatment <- list(error_rate = 0.025, latency_p95 = 220)
control <- list(error_rate = 0.020, latency_p95 = 200)
thresholds <- list(error_rate = 20, latency_p95 = 15)  # % increase

results <- check_guardrails(treatment, control, thresholds)

for (metric in names(results)) {
  r <- results[[metric]]
  cat(sprintf("\n%s: %s\n", toupper(metric), r$status))
  cat(sprintf("  Treatment: %.3f, Control: %.3f\n", r$treatment, r$control))
  cat(sprintf("  Difference: %.1f%% (threshold: %.1f%%)\n",
              r$difference_pct, r$threshold_pct))
}
Pre-Launch Checklist
## Guardrail Pre-Launch Checklist

### Guardrail Definition
- [ ] Primary guardrails identified (error rate, latency, crashes)
- [ ] Secondary guardrails based on feature type
- [ ] Thresholds set based on historical variance
- [ ] Thresholds documented in experiment plan

### Monitoring Setup
- [ ] Real-time dashboards configured
- [ ] Alerts configured with correct thresholds
- [ ] Alert routing to correct channels/people
- [ ] Tested alert system with fake data

### Ramp Plan
- [ ] Ramp schedule defined
- [ ] Criteria for advancing to next stage
- [ ] Rollback plan documented
- [ ] Owner for each ramp decision

### Response Plan
- [ ] On-call rotation for experiment period
- [ ] Escalation path documented
- [ ] Rollback procedure tested
- [ ] Post-mortem template ready
Related Articles
- Analytics Reporting (Pillar) - Complete reporting guide
- SRM Detection - Sample ratio mismatch
- Sequential Testing - Valid early stopping
- When to Say Inconclusive - Decision rules
Key Takeaway
Guardrails protect your experiments, your users, and your credibility. Define them before launch: metrics that must not regress (error rates, latency, crashes, revenue), thresholds that trigger alerts (typically 10-20% increase), and clear actions for violations (pause, investigate, rollback). Ramp exposure gradually—1% catches bugs, 10% validates at scale, 50% confirms consistency—with automated monitoring at each stage. When a guardrail fires, take it seriously: investigate before dismissing as noise. The cost of a false alarm is inconvenience; the cost of shipping a broken feature is user harm and lost trust. Err on the side of caution.
References
- https://www.microsoft.com/en-us/research/publication/top-challenges-from-the-first-practical-online-controlled-experiments-summit/
- https://arxiv.org/abs/1710.08217
- https://www.exp-platform.com/Documents/controlledExperimentDMKD.pdf
- Kohavi, R., Tang, D., & Xu, Y. (2020). *Trustworthy Online Controlled Experiments: A Practical Guide to A/B Testing*. Cambridge University Press.
- Fabijan, A., et al. (2017). The benefits of controlled experimentation at scale. *ICSE-SEIP*, 137-146.
- Deng, A., et al. (2017). Trustworthy analysis of online A/B tests: Pitfalls, challenges and solutions. *WSDM*, 641-649.
Frequently Asked Questions
What metrics should be guardrails?
How sensitive should guardrail thresholds be?
When should I stop an experiment early?
Key Takeaway
Guardrails protect your experiments, your users, and your credibility. Define them before launch: metrics that must not regress (error rates, latency, crashes), thresholds that trigger alerts (20% increase), and actions for violations (pause, investigate, rollback). Ramp exposure gradually—1% catches bugs, 10% validates at scale, 50% confirms consistency—with automated monitoring at each stage. When a guardrail fires, take it seriously: investigate before dismissing as noise. The cost of a false alarm is low; the cost of shipping a broken feature is high.