Contents
Bayesian vs. Frequentist: A Practical Comparison for Analysts
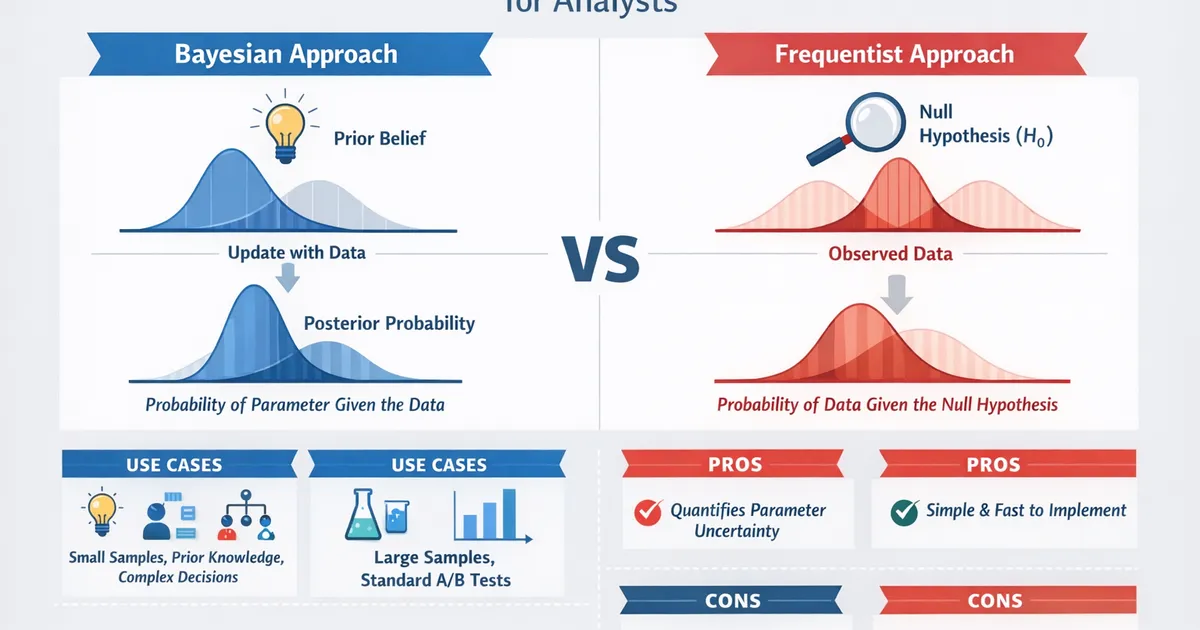
Side-by-side comparison of Bayesian and frequentist methods for product analysts. Learn which approach fits your problem, team, and decision context.
Quick Hits
- •Frequentist: 'What is the probability of seeing this data if the null is true?' Bayesian: 'What is the probability the parameter takes this value given the data?'
- •Frequentist methods are simpler, faster, and widely understood -- but the output is often misinterpreted
- •Bayesian methods directly answer business questions but require choosing priors and more computation
- •For large-sample standard A/B tests, both methods give nearly identical conclusions
- •The real advantage of Bayesian methods shows up with small samples, prior knowledge, and complex decisions
TL;DR
Frequentist and Bayesian statistics are two frameworks for inference. Frequentist methods test whether data is surprising under a null hypothesis. Bayesian methods compute the probability of hypotheses given the data. This guide compares them on the dimensions that matter for product analysts: interpretability, prior knowledge, sample size, computation, and decision-making.
The Core Difference
What Each Framework Answers
Frequentist: What is the probability of observing this data (or more extreme) if the null hypothesis is true?
Bayesian: What is the probability of the hypothesis (parameter value) given the observed data?
This difference sounds subtle but has major practical implications.
A Concrete Example
You run an A/B test. Conversion rate: Control = 12.0%, Treatment = 12.8%.
Frequentist result: "p = 0.03. We reject the null hypothesis at alpha = 0.05. The difference is statistically significant."
- What it does NOT say: the probability that treatment is better, or how much better it likely is.
Bayesian result: "There is a 97% probability that Treatment has a higher conversion rate. The expected lift is 0.8 percentage points with a 95% credible interval of [0.1%, 1.5%]."
- Directly answers: is it better, by how much, and how confident are we?
Side-by-Side Comparison
| Dimension | Frequentist | Bayesian |
|---|---|---|
| Core output | p-value, confidence interval | Posterior distribution, credible interval |
| Interpretation | "If null is true, probability of data this extreme" | "Probability the parameter is in this range" |
| Prior knowledge | Not formally incorporated | Incorporated via prior distribution |
| Multiple testing | Requires explicit correction (Bonferroni, etc.) | Handled naturally through joint posterior |
| Peeking at results | Inflates false positive rate | No penalty for checking |
| Sample size | Must be fixed in advance (or use sequential methods) | Flexible -- decide when posterior is precise enough |
| Computation | Usually fast (closed-form solutions) | Can be slow (MCMC sampling) |
| Communication | Often misinterpreted | More intuitive probability statements |
| Regulatory acceptance | Standard in medicine, FDA | Growing acceptance, some resistance |
| Software | Built into every statistics package | Requires specialized tools (PyMC, Stan) |
When to Use Each
Choose Frequentist When
- Large sample sizes: With lots of data, frequentist and Bayesian results converge. Simpler wins.
- Standard tests: t-tests, chi-square, ANOVA -- well-established, fast, and sufficient.
- No useful prior information: If you genuinely know nothing, uninformative Bayesian priors give the same answer with more computation.
- Regulatory requirements: Some contexts (clinical trials, FDA submissions) require frequentist methods.
- Team familiarity: If everyone knows frequentist methods and results are clear, switching adds friction without benefit.
Choose Bayesian When
- Small sample sizes: Priors stabilize estimates when data is limited.
- Prior knowledge exists: Past experiments, domain expertise, or historical data that should inform your analysis.
- Complex decisions: When you need P(improvement > threshold), expected loss, or risk quantification.
- Multiple comparisons: Testing many variants, segments, or metrics simultaneously.
- Stakeholder communication: When "92% probability of improvement" is more useful than "p = 0.03."
- Sequential monitoring: When you want to check results during an experiment without error inflation.
The Same Analysis, Both Ways
Frequentist A/B Test
import numpy as np
from scipy import stats

# Data
control_conversions, control_n = 1200, 10000
treatment_conversions, treatment_n = 1280, 10000

# Proportions
p_c = control_conversions / control_n
p_t = treatment_conversions / treatment_n

# Pooled proportion and z-test
p_pool = (control_conversions + treatment_conversions) / (control_n + treatment_n)
se = np.sqrt(p_pool * (1 - p_pool) * (1/control_n + 1/treatment_n))
z = (p_t - p_c) / se
p_value = 2 * (1 - stats.norm.cdf(abs(z)))

# Confidence interval for difference
se_diff = np.sqrt(p_c*(1-p_c)/control_n + p_t*(1-p_t)/treatment_n)
ci = (p_t - p_c - 1.96*se_diff, p_t - p_c + 1.96*se_diff)

print("FREQUENTIST RESULT")
print(f"Difference: {p_t - p_c:.4f}")
print(f"z-statistic: {z:.3f}")
print(f"p-value: {p_value:.4f}")
print(f"95% CI: [{ci[0]:.4f}, {ci[1]:.4f}]")
print(f"Significant at alpha=0.05: {p_value < 0.05}")
Bayesian A/B Test
# Same data, Bayesian approach
from scipy import stats as sp_stats

control_post = sp_stats.beta(1 + 1200, 1 + 10000 - 1200)
treatment_post = sp_stats.beta(1 + 1280, 1 + 10000 - 1280)

n_samples = 100000
c_samples = control_post.rvs(n_samples)
t_samples = treatment_post.rvs(n_samples)
diff = t_samples - c_samples

print("\nBAYESIAN RESULT")
print(f"P(Treatment > Control): {np.mean(diff > 0):.1%}")
print(f"Expected lift: {np.mean(diff):.4f}")
print(f"95% credible interval: [{np.percentile(diff, 2.5):.4f}, {np.percentile(diff, 97.5):.4f}]")
print(f"P(lift > 0.5%): {np.mean(diff > 0.005):.1%}")
With 10,000 observations per group, the conclusions align. The difference is in what you can say and how easily stakeholders understand it.
Common Misunderstandings
Misunderstanding 1: "p < 0.05 means 95% chance the effect is real"
This is the most common statistical misinterpretation. The p-value is P(data | H0), not P(H0 | data). The probability the effect is real is a Bayesian quantity that requires a prior.
Misunderstanding 2: "Bayesian methods let you get significant results with less data"
Bayesian methods do not conjure evidence from thin air. With uninformative priors and the same data, Bayesian and frequentist conclusions are nearly identical. Priors help when they carry genuine information, not as a hack to reduce sample sizes.
Misunderstanding 3: "Priors make Bayesian results subjective"
All statistical analyses involve subjective choices: alpha level, one-tailed vs. two-tailed, which covariates to include, when to stop collecting data. Priors make one additional assumption explicit. With enough data, the prior is overwhelmed and results are objective.
Misunderstanding 4: "You have to pick one framework"
Many practicing analysts use both. Frequentist for routine large-sample tests. Bayesian when they need richer inference, have prior information, or need to communicate probability directly.
Practical Decision Framework
Do you have useful prior information?
├── Yes → Bayesian (priors improve estimates)
└── No
    ├── Is the sample large (>1000 per group)?
    │   ├── Yes → Either works (frequentist is simpler)
    │   └── No → Bayesian (priors stabilize small samples)
    └── Do you need P(effect > threshold)?
        ├── Yes → Bayesian (direct probability statements)
        └── No → Frequentist (simpler, faster)
Related Methods
- Bayesian Methods Overview (Pillar) - Comprehensive Bayesian guide
- Bayesian A/B Testing - Posterior probabilities for experiments
- Credible vs. Confidence Intervals - Interval comparison
- Prior Selection - Choosing Bayesian priors
Key Takeaway
Bayesian and frequentist methods answer different questions. Frequentist asks about the probability of the data under the null; Bayesian asks about the probability of the parameter given the data. For product analytics, Bayesian is more natural when you need direct probability statements, have prior knowledge, or face complex decisions. Frequentist is simpler and sufficient for standard large-sample tests. Choose based on your problem, not ideology.
References
- https://doi.org/10.1038/s41562-017-0189-z
- https://doi.org/10.3758/s13423-016-1221-4
- https://mc-stan.org/users/documentation/
Frequently Asked Questions
Are Bayesian results always different from frequentist results?
Is one approach more 'correct' than the other?
Can I use both in the same analysis?
Key Takeaway
Bayesian and frequentist methods answer different questions. Frequentist asks about the probability of the data under the null; Bayesian asks about the probability of the parameter given the data. For product analytics, Bayesian is more natural when you need direct probability statements, have prior knowledge, or face complex decisions. Frequentist is simpler and sufficient for standard large-sample tests. Choose based on your problem, not ideology.