Contents
Poisson Regression
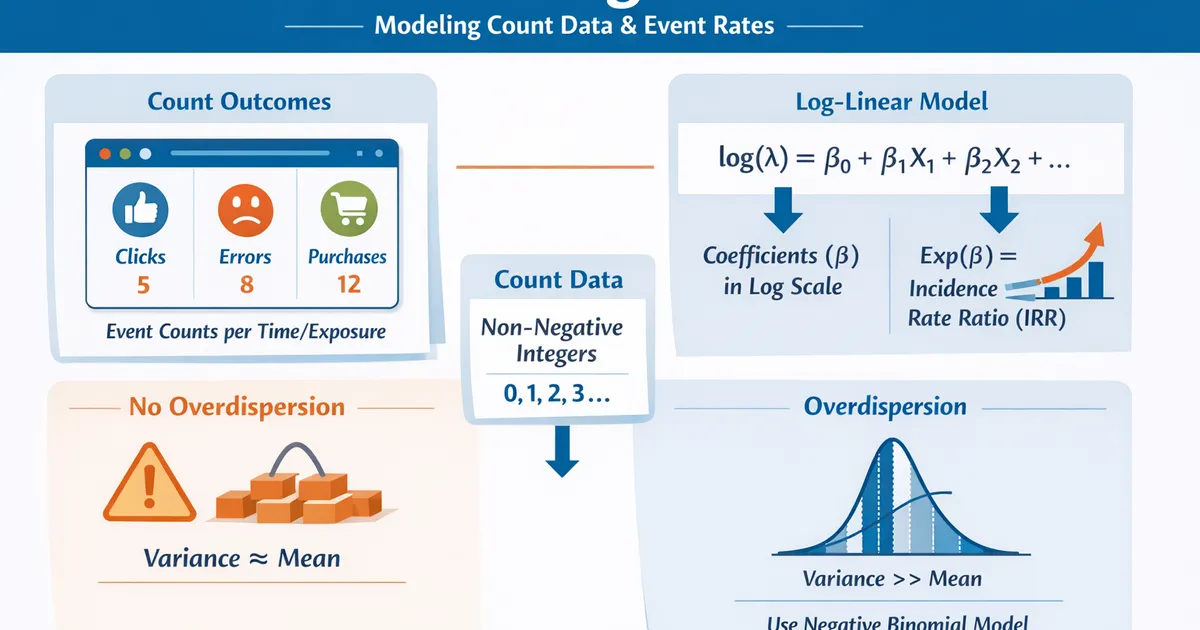
Poisson Regression models count data and event rates. Use it when your outcome is a count of events (e.g., clicks, errors, purchases) and you want to understand which factors affect the rate.
Quick Hits
- •Models count outcomes: number of events per unit of time, exposure, or observation
- •Assumes the mean equals the variance (equidispersion)
- •Uses a log link: coefficients represent the log of the rate ratio
- •Exponentiated coefficients give incidence rate ratios (IRR)
- •If variance >> mean (overdispersion), use Negative Binomial Regression instead
The StatsTest Flow: Relationship or Prediction >> Prediction >> Count data outcome >> No overdispersion
Not sure this is the right statistical method? Use the Choose Your StatsTest workflow to select the right method.
What is Poisson Regression?
Poisson Regression is a generalized linear model (GLM) used to model count data and event rates. The outcome variable is a non-negative integer representing the number of times an event occurred (e.g., number of support tickets, number of purchases, number of errors).
The model uses a log link function, meaning it models the natural logarithm of the expected count as a linear function of the predictors. This ensures that predicted counts are always non-negative.
Poisson Regression is also called the Poisson Log-Linear Model, Log-Linear Regression (for count data), or the Poisson GLM.
Assumptions for Poisson Regression
The assumptions for Poisson Regression include:
- Count Outcome
- Equidispersion
- Independence
- Log-Linear Relationship
- No Excess Zeros (or use zero-inflated variant)
Count Outcome
The dependent variable must be a non-negative integer: 0, 1, 2, 3, and so on. Continuous outcomes, proportions, and binary outcomes require different models.
If your outcome is continuous, use Simple Linear Regression or Multiple Linear Regression. If your outcome is binary, use Logistic Regression.
Equidispersion
The Poisson distribution assumes the mean equals the variance. In practice, many count datasets are overdispersed (variance much greater than mean). Check this by comparing the residual deviance to the residual degrees of freedom. If the ratio is substantially greater than 1, overdispersion is present.
If overdispersed, use Negative Binomial Regression instead.
Independence
Observations must be independent. If counts come from the same subjects measured repeatedly, you need a mixed-effects Poisson model or GEE approach.
Log-Linear Relationship
The relationship between predictors and the log of the expected count should be approximately linear. Check residual plots for systematic patterns.
No Excess Zeros
If your data has far more zeros than a Poisson distribution would predict (many subjects with zero events), consider a zero-inflated Poisson model, which separately models the probability of being a "structural zero" versus having a count from the Poisson process.
When to use Poisson Regression?
You should use Poisson Regression in the following scenario:
- Your outcome is a count of events (0, 1, 2, 3...)
- You want to know which factors affect the event rate
- The variance is approximately equal to the mean
- Observations are independent
Count Data
Typical examples include: number of support tickets per user per week, number of crashes per deployment, number of purchases per customer per month, number of defects per manufacturing batch.
Rate Modeling
If subjects have different exposure times (e.g., users active for different durations), use an offset to model rates rather than raw counts.
If variance is much greater than the mean, use Negative Binomial Regression. If your outcome is binary, use Logistic Regression.
Poisson Regression Example
Outcome: Number of customer support tickets filed per user per month. Predictors: Account age, plan tier, number of active integrations.
We model the number of support tickets as a function of user characteristics. The Poisson model estimates coefficients on the log scale. Exponentiating a coefficient gives the incidence rate ratio (IRR).
For example, if the IRR for "premium plan" is 0.65, premium users file 35% fewer support tickets per month compared to free-tier users, controlling for account age and integrations. A -value means this effect is statistically significant.
References
- https://www.ncbi.nlm.nih.gov/pmc/articles/PMC2726498/
- https://online.stat.psu.edu/stat504/lesson/9
Frequently Asked Questions
When should I use Poisson regression instead of linear regression?
What is overdispersion and why does it matter?
Can I include an offset or exposure variable?
Key Takeaway
Poisson regression is the standard model for count data where you want to understand which factors drive event frequency. It works best when counts are not overdispersed (variance roughly equals mean). For overdispersed data, switch to Negative Binomial Regression.