Contents
Drift Detection: KS Test, PSI, and Interpreting Signals
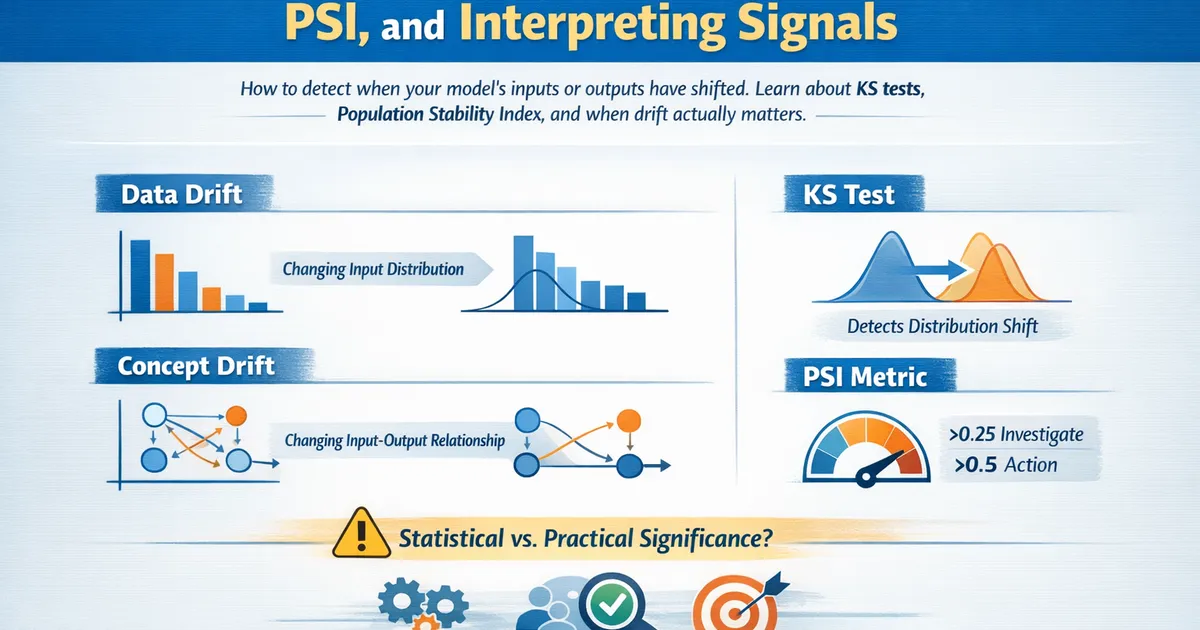
How to detect when your model's inputs or outputs have shifted. Learn about KS tests, Population Stability Index, and when drift actually matters.
Quick Hits
- •Data drift: input distribution changes (features look different)
- •Concept drift: relationship between inputs and outputs changes (same features, different outcomes)
- •KS test: detects any distribution change, sensitive with large samples
- •PSI: practical threshold-based metric (>0.25 = investigate, >0.5 = action)
- •Statistical significance ≠ practical significance—small drift with large n is significant but harmless
TL;DR
Drift detection identifies when your model's environment has changed. Data drift means inputs look different; concept drift means the input-output relationship has changed. The KS test detects distribution changes but is oversensitive with large samples. PSI (Population Stability Index) provides practical thresholds for action. The key insight: statistically significant drift doesn't always mean problematic drift—focus on whether model performance actually degrades.
Types of Drift
Data Drift (Covariate Shift)
Input distribution changes, but the relationship between inputs and outputs stays the same.
Example: Your user base shifts younger
- Feature
agedistribution changes - But
P(purchase | age)relationship stays the same - Model trained on older users may extrapolate poorly
Concept Drift
Input-output relationship changes, even if input distribution is stable.
Example: Economic conditions change
- Same features (income, employment)
- But purchase behavior changes dramatically
- Model predicts poorly despite seeing familiar inputs
Prediction Drift
Model output distribution changes (regardless of cause).
Example: Model confidence shifts
- Model starts predicting more confidently
- Could be data drift, could be a bug
- Worth investigating either way
Kolmogorov-Smirnov (KS) Test
The Method
Compares two distributions by maximum difference between CDFs:
import numpy as np
from scipy import stats


def ks_drift_test(reference, current, alpha=0.05):
    """
    Two-sample KS test for drift detection.

    Parameters:
    -----------
    reference : array
        Baseline distribution (training or reference period)
    current : array
        Current distribution to compare

    Returns:
    --------
    dict with statistic, p-value, and interpretation
    """
    statistic, p_value = stats.ks_2samp(reference, current)

    # Effect size interpretation
    if statistic < 0.05:
        effect = "Negligible"
    elif statistic < 0.10:
        effect = "Small"
    elif statistic < 0.20:
        effect = "Medium"
    else:
        effect = "Large"

    return {
        'ks_statistic': statistic,
        'p_value': p_value,
        'statistically_significant': p_value < alpha,
        'effect_size': effect,
        'interpretation': f"{'Significant' if p_value < alpha else 'No significant'} drift detected (D={statistic:.3f})"
    }


# Example: Feature drift
np.random.seed(42)

# Reference period
reference = np.random.normal(50, 10, 10000)  # Age ~N(50, 10)

# Current period with slight drift
current = np.random.normal(48, 12, 10000)  # Younger, more variable

result = ks_drift_test(reference, current)

print("KS Drift Test")
print("=" * 50)
print(f"Reference: n={len(reference)}, mean={reference.mean():.1f}, std={reference.std():.1f}")
print(f"Current: n={len(current)}, mean={current.mean():.1f}, std={current.std():.1f}")
print(f"\nKS Statistic: {result['ks_statistic']:.4f}")
print(f"p-value: {result['p_value']:.4e}")
print(f"Effect size: {result['effect_size']}")
print(f"Interpretation: {result['interpretation']}")
The Problem with Large Samples
def demonstrate_ks_sensitivity():
    """
    KS test is overly sensitive with large samples.
    """
    np.random.seed(42)

    # Tiny drift: mean differs by 0.5 (5% of std)
    results = []

    for n in [100, 1000, 10000, 100000]:
        ref = np.random.normal(50, 10, n)
        cur = np.random.normal(50.5, 10, n)  # Tiny shift

        result = ks_drift_test(ref, cur)
        results.append({
            'n': n,
            'ks_stat': result['ks_statistic'],
            'p_value': result['p_value'],
            'significant': result['statistically_significant']
        })

    print("KS Sensitivity to Sample Size")
    print("(Same tiny drift: 0.5 unit mean shift)")
    print("=" * 60)
    print(f"{'n':>10} {'KS Stat':>12} {'p-value':>15} {'Significant':>12}")
    print("-" * 60)
    for r in results:
        print(f"{r['n']:>10,} {r['ks_stat']:>12.4f} {r['p_value']:>15.2e} {str(r['significant']):>12}")


demonstrate_ks_sensitivity()
Population Stability Index (PSI)
The Method
Compares distributions bin-by-bin:
Where:
- = actual (current) proportion in bin i
- = expected (reference) proportion in bin i
Implementation
def psi(reference, current, n_bins=10):
    """
    Population Stability Index for drift detection.

    Thresholds:
    - PSI < 0.10: No significant change
    - 0.10 ≤ PSI < 0.25: Moderate change, investigate
    - PSI ≥ 0.25: Significant change, action needed
    """
    # Define bins from reference
    _, bin_edges = np.histogram(reference, bins=n_bins)
    bin_edges[0] = -np.inf
    bin_edges[-1] = np.inf

    # Count proportions
    ref_counts, _ = np.histogram(reference, bins=bin_edges)
    cur_counts, _ = np.histogram(current, bins=bin_edges)

    ref_props = ref_counts / len(reference)
    cur_props = cur_counts / len(current)

    # Avoid division by zero
    ref_props = np.maximum(ref_props, 0.001)
    cur_props = np.maximum(cur_props, 0.001)

    # PSI calculation
    psi_values = (cur_props - ref_props) * np.log(cur_props / ref_props)
    psi_total = np.sum(psi_values)

    # Interpretation
    if psi_total < 0.10:
        interpretation = "No significant change"
        action = "None required"
    elif psi_total < 0.25:
        interpretation = "Moderate change"
        action = "Investigate"
    else:
        interpretation = "Significant change"
        action = "Action needed"

    return {
        'psi': psi_total,
        'bin_psi': psi_values.tolist(),
        'interpretation': interpretation,
        'action': action,
        'ref_props': ref_props.tolist(),
        'cur_props': cur_props.tolist()
    }


# Example
np.random.seed(42)
reference = np.random.normal(50, 10, 5000)
current_mild = np.random.normal(52, 10, 5000)  # Mild drift
current_severe = np.random.normal(60, 15, 5000)  # Severe drift

psi_mild = psi(reference, current_mild)
psi_severe = psi(reference, current_severe)

print("PSI Drift Detection")
print("=" * 50)
print("\nMild drift (mean: 50 → 52):")
print(f"  PSI: {psi_mild['psi']:.4f}")
print(f"  {psi_mild['interpretation']} - {psi_mild['action']}")

print("\nSevere drift (mean: 50 → 60, std: 10 → 15):")
print(f"  PSI: {psi_severe['psi']:.4f}")
print(f"  {psi_severe['interpretation']} - {psi_severe['action']}")
PSI Thresholds
| PSI Value | Interpretation | Action |
|---|---|---|
| < 0.10 | No significant change | Continue monitoring |
| 0.10 - 0.25 | Moderate change | Investigate causes |
| 0.25 - 0.50 | Significant change | Review model performance |
| > 0.50 | Severe change | Consider retraining |
Multi-Feature Drift Detection
def multi_feature_drift(reference_df, current_df, method='psi'):
    """
    Check drift across multiple features.
    """
    results = []

    for column in reference_df.columns:
        ref = reference_df[column].values
        cur = current_df[column].values

        if method == 'psi':
            result = psi(ref, cur)
            metric = result['psi']
            alert = result['psi'] >= 0.25
        else:  # ks
            result = ks_drift_test(ref, cur)
            metric = result['ks_statistic']
            alert = result['statistically_significant'] and result['ks_statistic'] > 0.1

        results.append({
            'feature': column,
            'metric': metric,
            'alert': alert
        })

    return sorted(results, key=lambda x: -x['metric'])


# Example: Multiple features
import pandas as pd

np.random.seed(42)
n = 5000

reference_df = pd.DataFrame({
    'age': np.random.normal(45, 15, n),
    'income': np.random.lognormal(10.5, 0.5, n),
    'tenure': np.random.exponential(5, n),
    'clicks': np.random.poisson(10, n)
})

# Current with drift in some features
current_df = pd.DataFrame({
    'age': np.random.normal(42, 15, n),  # Shifted
    'income': np.random.lognormal(10.5, 0.5, n),  # Same
    'tenure': np.random.exponential(4, n),  # Shifted
    'clicks': np.random.poisson(10, n)  # Same
})

drift_results = multi_feature_drift(reference_df, current_df, method='psi')

print("Multi-Feature Drift Report")
print("=" * 50)
print(f"{'Feature':<15} {'PSI':>10} {'Alert':>10}")
print("-" * 50)
for r in drift_results:
    alert_str = "⚠️ YES" if r['alert'] else "No"
    print(f"{r['feature']:<15} {r['metric']:>10.4f} {alert_str:>10}")
Prediction Drift Monitoring
def monitor_predictions(reference_preds, current_preds, thresholds=None):
    """
    Monitor drift in model predictions.
    """
    if thresholds is None:
        thresholds = {'ks': 0.1, 'psi': 0.25, 'mean_shift': 0.1}

    # KS test
    ks_result = ks_drift_test(reference_preds, current_preds)

    # PSI
    psi_result = psi(reference_preds, current_preds)

    # Mean shift
    mean_ref = np.mean(reference_preds)
    mean_cur = np.mean(current_preds)
    mean_shift = abs(mean_cur - mean_ref) / (np.std(reference_preds) + 1e-10)

    alerts = []
    if ks_result['ks_statistic'] > thresholds['ks']:
        alerts.append(f"KS statistic {ks_result['ks_statistic']:.3f} > {thresholds['ks']}")
    if psi_result['psi'] > thresholds['psi']:
        alerts.append(f"PSI {psi_result['psi']:.3f} > {thresholds['psi']}")
    if mean_shift > thresholds['mean_shift']:
        alerts.append(f"Mean shift {mean_shift:.3f} std > {thresholds['mean_shift']}")

    return {
        'ks': ks_result,
        'psi': psi_result,
        'mean_shift': mean_shift,
        'mean_reference': mean_ref,
        'mean_current': mean_cur,
        'alerts': alerts,
        'status': 'ALERT' if alerts else 'OK'
    }


# Example: Model prediction monitoring
np.random.seed(42)
ref_preds = np.random.beta(5, 2, 5000)  # Reference predictions
cur_preds = np.random.beta(4, 2, 5000)  # Slightly shifted

monitor_result = monitor_predictions(ref_preds, cur_preds)

print("Prediction Drift Monitor")
print("=" * 50)
print(f"Reference: mean={monitor_result['mean_reference']:.3f}")
print(f"Current: mean={monitor_result['mean_current']:.3f}")
print(f"\nKS Statistic: {monitor_result['ks']['ks_statistic']:.4f}")
print(f"PSI: {monitor_result['psi']['psi']:.4f}")
print(f"Mean Shift: {monitor_result['mean_shift']:.3f} std")
print(f"\nStatus: {monitor_result['status']}")
if monitor_result['alerts']:
    print("Alerts:")
    for alert in monitor_result['alerts']:
        print(f"  - {alert}")
When Drift Matters
Decision Framework
DRIFT DETECTED
       ↓
QUESTION: Is model performance degrading?
├── Yes → Investigate and potentially retrain
└── No → Continue monitoring
       ↓
QUESTION: Is the drift expected?
├── Yes (seasonal, known changes) → Document and monitor
└── No (unexpected) → Investigate root cause
       ↓
QUESTION: Is drift in important features?
├── Yes (top predictors) → Higher priority
└── No (low-importance features) → Lower priority
       ↓
ACTION:
- Minor drift, stable performance → Continue monitoring
- Moderate drift, slight degradation → Investigate
- Severe drift, degraded performance → Retrain or alert
Correlation with Performance
def drift_performance_analysis(ref_X, ref_y, cur_X, cur_y, model, feature_names):
    """
    Analyze relationship between feature drift and performance.
    """
    from sklearn.metrics import roc_auc_score

    # Feature drift
    drift_scores = []
    for i, name in enumerate(feature_names):
        result = psi(ref_X[:, i], cur_X[:, i])
        drift_scores.append({
            'feature': name,
            'psi': result['psi']
        })

    # Performance
    ref_auc = roc_auc_score(ref_y, model.predict_proba(ref_X)[:, 1])
    cur_auc = roc_auc_score(cur_y, model.predict_proba(cur_X)[:, 1])

    return {
        'drift_scores': sorted(drift_scores, key=lambda x: -x['psi']),
        'ref_auc': ref_auc,
        'cur_auc': cur_auc,
        'auc_change': cur_auc - ref_auc,
        'performance_degraded': cur_auc < ref_auc - 0.02
    }
R Implementation
# KS test
ks.test(reference, current)

# PSI function
psi <- function(ref, cur, n_bins = 10) {
    breaks <- quantile(ref, probs = seq(0, 1, length.out = n_bins + 1))
    ref_props <- table(cut(ref, breaks, include.lowest = TRUE)) / length(ref)
    cur_props <- table(cut(cur, breaks, include.lowest = TRUE)) / length(cur)

    # Avoid zeros
    ref_props <- pmax(ref_props, 0.001)
    cur_props <- pmax(cur_props, 0.001)

    sum((cur_props - ref_props) * log(cur_props / ref_props))
}
Related Methods
- Model Evaluation (Pillar) - Complete framework
- Calibration Checks - When confidence drifts
- Bootstrap for Metric Deltas - Uncertainty in metrics
- Meaningful vs. Significant - Practical thresholds
Key Takeaway
Drift detection tells you when the world has changed—input distributions shifting (data drift) or relationships changing (concept drift). Use KS tests for statistical detection but beware of oversensitivity with large samples. PSI provides practical thresholds that focus on actionable drift levels. The key question isn't "has the distribution changed?" (it probably has), but "does this change affect my model's usefulness?" Monitor features, predictions, and outcomes together; drift that doesn't hurt performance may not need action.
References
- https://arxiv.org/abs/1908.04240
- https://docs.aws.amazon.com/sagemaker/latest/dg/model-monitor-model-quality-baseline.html
- https://www.jstor.org/stable/2280095
- Lu, J., Liu, A., Dong, F., et al. (2018). Learning under concept drift: A review. *IEEE TKDE*, 31(12), 2346-2363.
- Yeh, I. C. (2007). Dataset documentation: Default of credit card clients. *UCI ML Repository*.
- Kolmogorov, A. (1933). Sulla determinazione empirica di una legge di distribuzione. *Giornale dell'Istituto Italiano degli Attuari*, 4, 83-91.
Frequently Asked Questions
What's the difference between data drift and concept drift?
My KS test is always significant—is that a problem?
How often should I check for drift?
Key Takeaway
Drift detection tells you when distributions have changed—inputs looking different (data drift) or input-output relationships changing (concept drift). Use KS tests for statistical detection and PSI for practical significance. Be careful with large samples: statistically significant drift can be practically irrelevant. Focus on whether drift affects model performance, not just whether it exists. Monitor features, predictions, and outcomes together to distinguish harmless shift from model degradation.