Contents
Calibration Checks: Brier Score and Reliability Diagrams
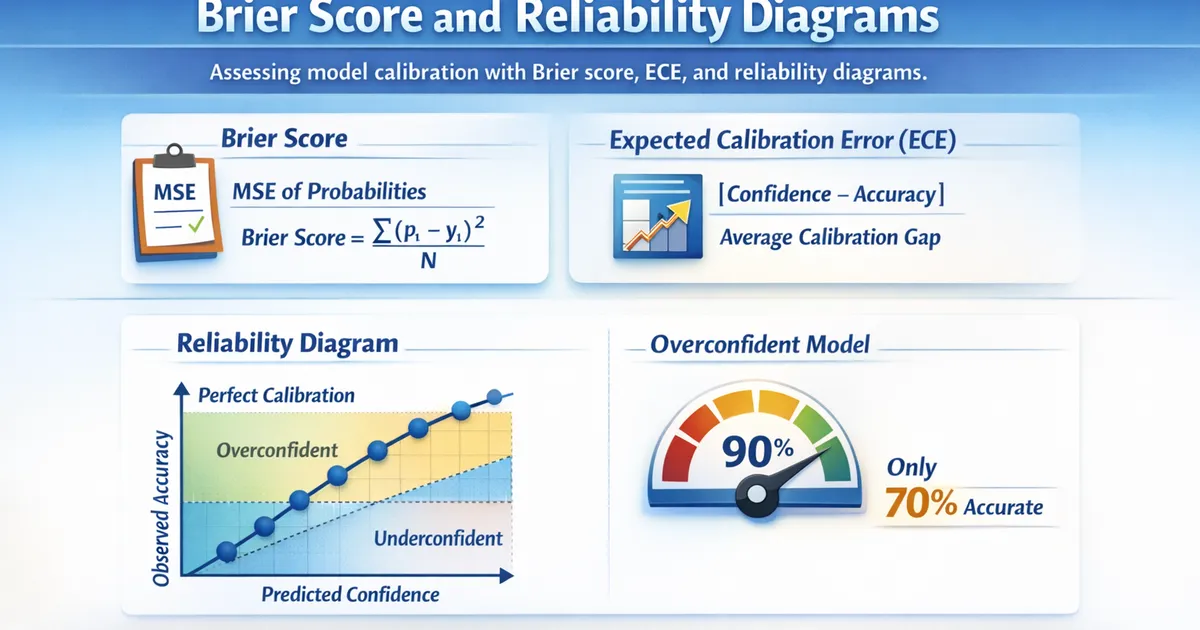
A model can have high accuracy but terrible probability estimates. Learn how to assess calibration with Brier score, ECE, and reliability diagrams.
Quick Hits
- •Calibration: when model says 80% confident, it should be right 80% of the time
- •Brier score = mean squared error of probability predictions
- •ECE (Expected Calibration Error) = average gap between confidence and accuracy
- •Reliability diagrams visualize calibration across confidence levels
- •Overconfident models: high confidence, not enough accuracy to match
TL;DR
Calibration means a model's confidence matches reality: when it says 80% confident, it should be right 80% of the time. Assess with Brier score (mean squared error of probabilities), ECE (expected calibration error), and reliability diagrams. Many models, especially neural networks, are overconfident—high confidence but lower accuracy. If you use probability outputs for decisions, check calibration alongside accuracy.
What Is Calibration?
Definition
A model is perfectly calibrated if:
For all confidence levels p ∈ [0, 1].
Why It Matters
| Use Case | Why Calibration Matters |
|---|---|
| Ranking by confidence | Need true probabilities to prioritize |
| Decision thresholds | "Act if P > 0.9" only works if 0.9 is meaningful |
| Ensemble averaging | Combining uncalibrated probs is garbage-in-garbage-out |
| Uncertainty estimates | For downstream systems that need reliable uncertainty |
Miscalibration Types
- Overconfident: Says 90% but only 70% accurate
- Underconfident: Says 60% but actually 85% accurate
- Systematic bias: Always off in one direction
Brier Score
Definition
Where:
- = predicted probability for positive class
- = true label (0 or 1)
Implementation
import numpy as np
from sklearn.metrics import brier_score_loss


def brier_score(y_true, y_prob):
    """
    Compute Brier score.

    Lower is better. 0 = perfect, 1 = worst.
    """
    return np.mean((y_prob - y_true) ** 2)


def brier_skill_score(y_true, y_prob):
    """
    Brier Skill Score: improvement over naive baseline.

    BSS = 1 - Brier / Brier_baseline
    BSS = 1 means perfect, 0 means no better than baseline, <0 means worse.
    """
    brier = brier_score(y_true, y_prob)
    brier_baseline = np.var(y_true)  # Equivalent to predicting mean

    return 1 - brier / brier_baseline if brier_baseline > 0 else 0


# Example
np.random.seed(42)
n = 1000

y_true = np.random.binomial(1, 0.3, n)

# Well-calibrated model
prob_calibrated = y_true * np.random.beta(8, 2, n) + (1 - y_true) * np.random.beta(2, 8, n)

# Overconfident model
prob_overconfident = np.clip(prob_calibrated * 1.5 - 0.25, 0, 1)

# Random model
prob_random = np.random.random(n)

print("Brier Score Comparison")
print("=" * 50)
print(f"Base rate: {y_true.mean():.2f}")
print(f"Baseline Brier (predict mean): {np.var(y_true):.4f}")
print(f"\nCalibrated model:")
print(f"  Brier score: {brier_score(y_true, prob_calibrated):.4f}")
print(f"  Skill score: {brier_skill_score(y_true, prob_calibrated):.4f}")

print(f"\nOverconfident model:")
print(f"  Brier score: {brier_score(y_true, prob_overconfident):.4f}")
print(f"  Skill score: {brier_skill_score(y_true, prob_overconfident):.4f}")

print(f"\nRandom model:")
print(f"  Brier score: {brier_score(y_true, prob_random):.4f}")
print(f"  Skill score: {brier_skill_score(y_true, prob_random):.4f}")
Brier Score Decomposition
def brier_decomposition(y_true, y_prob, n_bins=10):
    """
    Decompose Brier score into reliability, resolution, and uncertainty.

    Brier = Reliability - Resolution + Uncertainty

    - Reliability: calibration error (lower better)
    - Resolution: ability to discriminate (higher better)
    - Uncertainty: inherent difficulty (constant for data)
    """
    bins = np.linspace(0, 1, n_bins + 1)
    bin_indices = np.digitize(y_prob, bins) - 1
    bin_indices = np.clip(bin_indices, 0, n_bins - 1)

    n = len(y_true)
    base_rate = np.mean(y_true)

    reliability = 0
    resolution = 0

    for i in range(n_bins):
        mask = bin_indices == i
        n_k = mask.sum()

        if n_k > 0:
            o_k = y_true[mask].mean()  # Observed frequency
            f_k = y_prob[mask].mean()  # Forecast probability

            reliability += n_k * (f_k - o_k) ** 2
            resolution += n_k * (o_k - base_rate) ** 2

    reliability /= n
    resolution /= n
    uncertainty = base_rate * (1 - base_rate)

    return {
        'brier': brier_score(y_true, y_prob),
        'reliability': reliability,
        'resolution': resolution,
        'uncertainty': uncertainty,
        'reconstructed': reliability - resolution + uncertainty
    }


decomp = brier_decomposition(y_true, prob_calibrated)
print("\nBrier Score Decomposition (Calibrated Model)")
print("=" * 50)
print(f"Brier score: {decomp['brier']:.4f}")
print(f"= Reliability: {decomp['reliability']:.4f}")
print(f"- Resolution: {decomp['resolution']:.4f}")
print(f"+ Uncertainty: {decomp['uncertainty']:.4f}")
print(f"= Reconstructed: {decomp['reconstructed']:.4f}")
Expected Calibration Error (ECE)
Definition
Weighted average of calibration gaps across confidence bins.
Implementation
def expected_calibration_error(y_true, y_prob, n_bins=10):
    """
    Expected Calibration Error (ECE).

    Lower is better. 0 = perfect calibration.
    """
    bins = np.linspace(0, 1, n_bins + 1)
    bin_indices = np.digitize(y_prob, bins) - 1
    bin_indices = np.clip(bin_indices, 0, n_bins - 1)

    ece = 0
    bin_details = []

    for i in range(n_bins):
        mask = bin_indices == i
        n_in_bin = mask.sum()

        if n_in_bin > 0:
            accuracy = y_true[mask].mean()
            confidence = y_prob[mask].mean()
            gap = abs(accuracy - confidence)

            ece += (n_in_bin / len(y_true)) * gap

            bin_details.append({
                'bin': i,
                'range': (bins[i], bins[i+1]),
                'n': n_in_bin,
                'accuracy': accuracy,
                'confidence': confidence,
                'gap': gap
            })

    return {
        'ece': ece,
        'bin_details': bin_details
    }


# Compare ECE
ece_calib = expected_calibration_error(y_true, prob_calibrated)
ece_over = expected_calibration_error(y_true, prob_overconfident)

print("Expected Calibration Error")
print("=" * 50)
print(f"Calibrated model ECE: {ece_calib['ece']:.4f}")
print(f"Overconfident model ECE: {ece_over['ece']:.4f}")

print("\nBin-by-Bin (Calibrated):")
print(f"{'Bin':>8} {'Range':>15} {'N':>8} {'Acc':>8} {'Conf':>8} {'Gap':>8}")
for b in ece_calib['bin_details'][:5]:
    print(f"{b['bin']:>8} {f'[{b[\"range\"][0]:.1f}-{b[\"range\"][1]:.1f})':>15} "
          f"{b['n']:>8} {b['accuracy']:>8.3f} {b['confidence']:>8.3f} {b['gap']:>8.3f}")
Maximum Calibration Error (MCE)
def maximum_calibration_error(y_true, y_prob, n_bins=10):
    """
    Maximum gap across bins—worst-case calibration.
    """
    ece_result = expected_calibration_error(y_true, y_prob, n_bins)
    gaps = [b['gap'] for b in ece_result['bin_details']]
    return max(gaps) if gaps else 0
Reliability Diagrams
import matplotlib.pyplot as plt


def reliability_diagram(y_true, y_prob, n_bins=10, name='Model'):
    """
    Create reliability diagram.

    Perfect calibration = diagonal line.
    """
    ece_result = expected_calibration_error(y_true, y_prob, n_bins)

    fig, axes = plt.subplots(1, 2, figsize=(12, 5))

    # Left: Reliability diagram
    ax1 = axes[0]

    bin_midpoints = []
    accuracies = []
    confidences = []
    bin_sizes = []

    for b in ece_result['bin_details']:
        midpoint = (b['range'][0] + b['range'][1]) / 2
        bin_midpoints.append(midpoint)
        accuracies.append(b['accuracy'])
        confidences.append(b['confidence'])
        bin_sizes.append(b['n'])

    # Perfect calibration line
    ax1.plot([0, 1], [0, 1], 'k--', label='Perfect calibration')

    # Model calibration
    ax1.bar(bin_midpoints, accuracies, width=0.1, alpha=0.7,
            edgecolor='black', label=f'{name} (ECE={ece_result["ece"]:.3f})')

    ax1.set_xlabel('Mean Predicted Probability')
    ax1.set_ylabel('Fraction of Positives')
    ax1.set_title('Reliability Diagram')
    ax1.legend()
    ax1.set_xlim(0, 1)
    ax1.set_ylim(0, 1)

    # Right: Confidence histogram
    ax2 = axes[1]
    ax2.hist(y_prob, bins=n_bins, range=(0, 1), alpha=0.7, edgecolor='black')
    ax2.set_xlabel('Predicted Probability')
    ax2.set_ylabel('Count')
    ax2.set_title('Confidence Distribution')

    plt.tight_layout()
    return fig


# Example
fig = reliability_diagram(y_true, prob_overconfident, name='Overconfident')
plt.show()
Comparing Multiple Models
def compare_calibration(y_true, model_probs, model_names):
    """
    Compare calibration across multiple models.
    """
    results = []

    for name, probs in zip(model_names, model_probs):
        brier = brier_score(y_true, probs)
        ece = expected_calibration_error(y_true, probs)['ece']
        mce = maximum_calibration_error(y_true, probs)

        results.append({
            'name': name,
            'brier': brier,
            'ece': ece,
            'mce': mce
        })

    return results


# Compare
models = [prob_calibrated, prob_overconfident, prob_random]
names = ['Calibrated', 'Overconfident', 'Random']

comparison = compare_calibration(y_true, models, names)

print("Calibration Comparison")
print("=" * 50)
print(f"{'Model':<15} {'Brier':>10} {'ECE':>10} {'MCE':>10}")
print("-" * 50)
for r in comparison:
    print(f"{r['name']:<15} {r['brier']:>10.4f} {r['ece']:>10.4f} {r['mce']:>10.4f}")
Calibrating Models
Temperature Scaling
from scipy.optimize import minimize


def temperature_scaling(logits, y_true):
    """
    Find optimal temperature for calibration.

    Lower temperature = more confident
    Higher temperature = less confident
    """
    def neg_log_likelihood(T):
        scaled_probs = 1 / (1 + np.exp(-logits / T))
        eps = 1e-15
        scaled_probs = np.clip(scaled_probs, eps, 1 - eps)
        return -np.mean(y_true * np.log(scaled_probs) +
                        (1 - y_true) * np.log(1 - scaled_probs))

    result = minimize(neg_log_likelihood, x0=1.0, bounds=[(0.01, 10)])
    optimal_T = result.x[0]

    calibrated_probs = 1 / (1 + np.exp(-logits / optimal_T))

    return {
        'temperature': optimal_T,
        'calibrated_probs': calibrated_probs
    }


# Example: Calibrate overconfident model
# Convert to logits
logits = np.log(prob_overconfident / (1 - prob_overconfident + 1e-10))
logits = np.clip(logits, -10, 10)

temp_result = temperature_scaling(logits, y_true)

print("Temperature Scaling")
print("=" * 50)
print(f"Optimal temperature: {temp_result['temperature']:.3f}")
print(f"ECE before: {expected_calibration_error(y_true, prob_overconfident)['ece']:.4f}")
print(f"ECE after: {expected_calibration_error(y_true, temp_result['calibrated_probs'])['ece']:.4f}")
R Implementation
library(verification)

# Brier score
brier_score <- function(y_true, y_prob) {
    mean((y_prob - y_true)^2)
}

# Reliability diagram
reliability.plot(y_true, y_prob)

# Using verification package
verify(y_true, y_prob, frcst.type = "prob", obs.type = "binary")
Reporting Template
## Calibration Analysis

### Summary Statistics
| Metric | Value |
|--------|-------|
| Brier Score | 0.152 |
| ECE | 0.045 |
| MCE | 0.089 |

### Interpretation
Model is slightly overconfident (ECE > 0). In the 0.8-0.9
confidence bin, observed accuracy is 0.74 (gap = 0.11).

### Reliability Diagram
[Insert figure]

### Recommendation
Model requires calibration for probability-based decisions.
Temperature scaling with T=1.3 reduces ECE from 0.045 to 0.012.
Related Methods
- Model Evaluation (Pillar) - Complete framework
- Bootstrap for Metric Deltas - Uncertainty for metrics
- Drift Detection - When calibration changes
- Comparing Models: Win Rate - Model comparison
Key Takeaway
Calibration measures whether confidence matches accuracy—a 70% confident prediction should be right 70% of the time. Assess with Brier score (overall), ECE (average miscalibration), and reliability diagrams (visual). Many models, especially deep learning, are overconfident. If you use probability outputs for decisions, thresholds, or downstream systems, check and fix calibration. Temperature scaling is a simple, effective fix. Report calibration metrics alongside accuracy—a perfectly accurate model with terrible calibration can still lead to poor decisions.
References
- https://doi.org/10.1145/3292500.3330888
- https://arxiv.org/abs/1706.04599
- https://www.jstor.org/stable/2987588
- Guo, C., Pleiss, G., Sun, Y., & Weinberger, K. Q. (2017). On calibration of modern neural networks. *ICML*, 1321-1330.
- Niculescu-Mizil, A., & Caruana, R. (2005). Predicting good probabilities with supervised learning. *ICML*, 625-632.
- Brier, G. W. (1950). Verification of forecasts expressed in terms of probability. *Monthly Weather Review*, 78(1), 1-3.
Frequently Asked Questions
Why does calibration matter if my accuracy is good?
What's a good Brier score?
How do I fix poor calibration?
Key Takeaway
Calibration measures whether a model's confidence matches its accuracy. A well-calibrated model saying '80% confident' is right about 80% of the time. Assess with Brier score (overall), ECE (average miscalibration), and reliability diagrams (visual). Overconfident models are common—they claim high confidence but don't deliver matching accuracy. If you use probability outputs for decisions, calibration is as important as accuracy.