Contents
CUPED and Variance Reduction: When It Helps and When It Backfires
Learn how CUPED (Controlled-experiment Using Pre-Experiment Data) can dramatically reduce variance in A/B tests, when to use it, and the pitfalls that can make it backfire.
Quick Hits
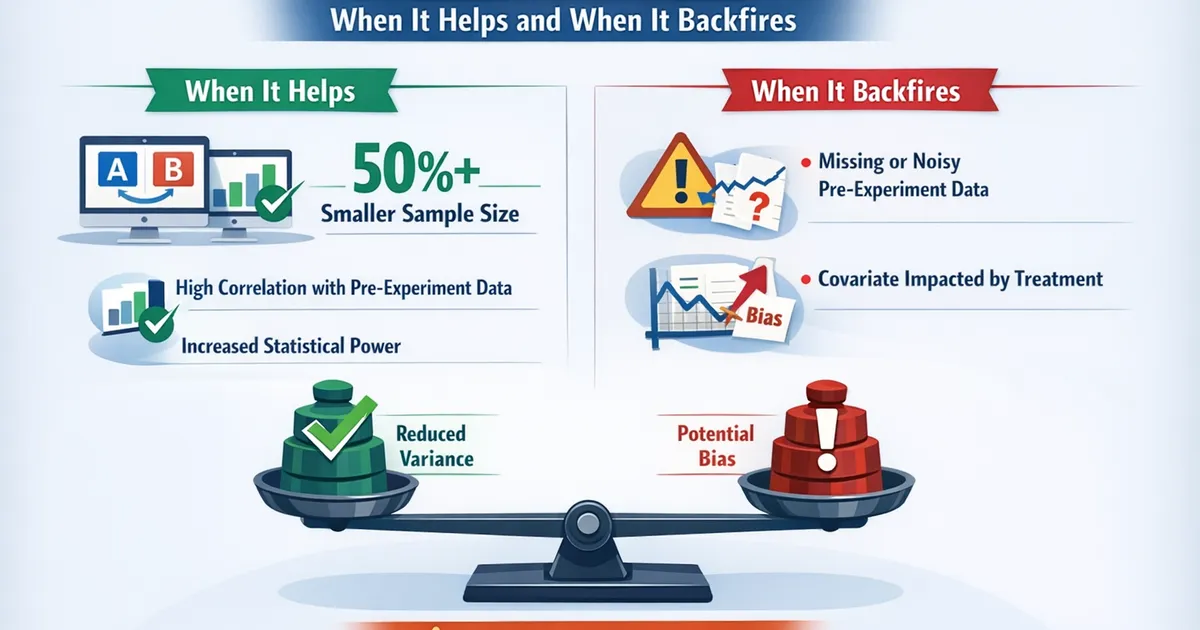
- •CUPED can reduce required sample size by 50%+ when pre-experiment covariates correlate strongly with outcomes
- •The variance reduction equals 1 - ρ², where ρ is the correlation between pre and during-experiment metrics
- •CUPED fails or backfires when pre-experiment data is missing, poorly measured, or weakly correlated
- •Always check that treatment doesn't affect the covariate—otherwise CUPED introduces bias
TL;DR
CUPED (Controlled-experiment Using Pre-Experiment Data) adjusts your experiment metric using each user's pre-experiment behavior, dramatically reducing noise when pre and during-experiment metrics correlate. A user who historically spends $100/week and spends $105 during the experiment is more informative than knowing only "$105." This context reduces variance, tightening confidence intervals and enabling smaller sample sizes.
The Core Idea
Users aren't identical. Some are highly engaged, others barely active. Some spend heavily, others never convert. This natural variation creates noise that obscures treatment effects.
But much of this variation is predictable. If a user spent $100 last week, they'll probably spend close to $100 this week too. If you can explain away this baseline variation, what remains is mostly the treatment effect you're trying to measure.
The CUPED Adjustment
CUPED transforms your outcome metric:
Where:
- = outcome during experiment
- = pre-experiment covariate (same metric, measured before)
- = mean of across all users
- = optimal adjustment coefficient
Why This Works
The variance of the CUPED-adjusted metric is:
Where is the correlation between and .
| Correlation () | Variance Reduction | Sample Size Reduction |
|---|---|---|
| 0.3 | 9% | 9% |
| 0.5 | 25% | 25% |
| 0.7 | 51% | 51% |
| 0.8 | 64% | 64% |
| 0.9 | 81% | 81% |
With , you need half the sample to achieve the same power!
Implementation
Python Implementation
import numpy as np
from scipy import stats

def cuped_adjustment(Y_experiment, X_pre_experiment):
    """
    Apply CUPED adjustment to experiment outcomes.

    Args:
        Y_experiment: Outcome metric during experiment (per user)
        X_pre_experiment: Same metric measured before experiment (per user)

    Returns:
        CUPED-adjusted outcomes
    """
    # Calculate optimal theta
    covariance = np.cov(Y_experiment, X_pre_experiment)[0, 1]
    variance_x = np.var(X_pre_experiment)

    if variance_x == 0:
        return Y_experiment  # No adjustment possible

    theta = covariance / variance_x

    # Adjust outcomes
    X_centered = X_pre_experiment - np.mean(X_pre_experiment)
    Y_cuped = Y_experiment - theta * X_centered

    return Y_cuped


def cuped_ab_test(control_Y, control_X, treatment_Y, treatment_X):
    """
    Run A/B test with CUPED adjustment.

    Returns results with and without CUPED for comparison.
    """
    # Without CUPED
    t_stat_raw, p_raw = stats.ttest_ind(control_Y, treatment_Y)
    diff_raw = np.mean(treatment_Y) - np.mean(control_Y)
    se_raw = np.sqrt(np.var(control_Y)/len(control_Y) +
                     np.var(treatment_Y)/len(treatment_Y))

    # With CUPED
    # Calculate theta from pooled data
    all_Y = np.concatenate([control_Y, treatment_Y])
    all_X = np.concatenate([control_X, treatment_X])

    theta = np.cov(all_Y, all_X)[0, 1] / np.var(all_X)
    X_mean = np.mean(all_X)

    control_Y_cuped = control_Y - theta * (control_X - X_mean)
    treatment_Y_cuped = treatment_Y - theta * (treatment_X - X_mean)

    t_stat_cuped, p_cuped = stats.ttest_ind(control_Y_cuped, treatment_Y_cuped)
    diff_cuped = np.mean(treatment_Y_cuped) - np.mean(control_Y_cuped)
    se_cuped = np.sqrt(np.var(control_Y_cuped)/len(control_Y_cuped) +
                       np.var(treatment_Y_cuped)/len(treatment_Y_cuped))

    # Correlation for reference
    rho = np.corrcoef(all_Y, all_X)[0, 1]

    return {
        'raw': {
            'difference': diff_raw,
            'std_error': se_raw,
            'p_value': p_raw
        },
        'cuped': {
            'difference': diff_cuped,
            'std_error': se_cuped,
            'p_value': p_cuped
        },
        'correlation': rho,
        'variance_reduction': 1 - (1 - rho**2)
    }
R Implementation
cuped_adjustment <- function(Y_experiment, X_pre_experiment) {
  theta <- cov(Y_experiment, X_pre_experiment) / var(X_pre_experiment)
  X_centered <- X_pre_experiment - mean(X_pre_experiment)
  Y_cuped <- Y_experiment - theta * X_centered
  return(Y_cuped)
}

cuped_ab_test <- function(control_Y, control_X, treatment_Y, treatment_X) {
  # Pool data for theta calculation
  all_Y <- c(control_Y, treatment_Y)
  all_X <- c(control_X, treatment_X)

  theta <- cov(all_Y, all_X) / var(all_X)
  X_mean <- mean(all_X)

  # Apply adjustment
  control_Y_cuped <- control_Y - theta * (control_X - X_mean)
  treatment_Y_cuped <- treatment_Y - theta * (treatment_X - X_mean)

  # Compare
  raw_test <- t.test(treatment_Y, control_Y)
  cuped_test <- t.test(treatment_Y_cuped, control_Y_cuped)

  list(
    raw_p = raw_test$p.value,
    raw_se = raw_test$stderr,
    cuped_p = cuped_test$p.value,
    cuped_se = cuped_test$stderr,
    correlation = cor(all_Y, all_X),
    variance_reduction = cor(all_Y, all_X)^2
  )
}
When CUPED Helps
Strong Correlation with Pre-Period
The obvious case: use pre-experiment values of the same metric as your covariate.
- Testing revenue changes? Use pre-experiment revenue per user
- Testing engagement? Use pre-experiment sessions per user
- Testing conversion? Use pre-experiment visit frequency (converts correlate with visits)
# Example: Revenue experiment
# Users who spent $100 pre-experiment → expect ~$100 during
# Users who spent $10 pre-experiment → expect ~$10 during
# This correlation is often 0.6-0.8 for weekly metrics

correlation = np.corrcoef(revenue_during, revenue_pre)[0, 1]
print(f"Correlation: {correlation:.2f}")
print(f"Potential variance reduction: {correlation**2:.0%}")
New User Experiments
For new users, you don't have pre-experiment data of the same metric. But you might have:
- Demographics (correlated with engagement)
- Acquisition channel (correlated with intent)
- First-session behavior (correlated with retention)
These covariates have weaker correlation but still help.
Ratio Metrics
For metrics like revenue per user or clicks per impression, CUPED can be applied to the numerator, the denominator, or both. Adjusting the numerator typically gives the best results.
When CUPED Backfires
Covariate Affected by Treatment
This is the critical failure mode. If your treatment affects the covariate, CUPED introduces bias.
Bad example: You're testing a new checkout flow. Your covariate is "add-to-cart events." But the new checkout flow changes the add-to-cart button too. Now your covariate is post-treatment, and CUPED adjusts away part of the treatment effect.
Rule: The covariate must be measured before treatment assignment or be unaffected by treatment.
Missing Pre-Experiment Data
CUPED requires pre-experiment data for each user. If 30% of users are new (no pre-period data), you have options:
- Exclude new users: Biases toward returning users
- Impute with population mean: Dilutes the adjustment
- Segment analysis: Run CUPED on returning users, standard analysis on new users
def cuped_with_missing(Y, X, missing_indicator):
    """
    Handle missing pre-experiment data in CUPED.

    Strategy: Use population mean for missing values (conservative).
    """
    X_imputed = X.copy()
    X_imputed[missing_indicator] = np.mean(X[~missing_indicator])

    return cuped_adjustment(Y, X_imputed)
Weak Correlation
If correlation is below 0.3, variance reduction is under 9%—not worth the complexity. Run standard analysis.
def should_use_cuped(Y, X, threshold=0.3):
    """Check if CUPED is worth applying."""
    correlation = np.corrcoef(Y, X)[0, 1]
    if abs(correlation) < threshold:
        print(f"Correlation {correlation:.2f} too weak. Skip CUPED.")
        return False
    else:
        print(f"Correlation {correlation:.2f} sufficient. "
              f"Expected variance reduction: {correlation**2:.0%}")
        return True
Noisy Covariate
If the covariate is poorly measured (sampling error, logging bugs), CUPED may add noise rather than remove it. The covariate should be as reliable as your outcome metric.
Treatment-Covariate Interaction
If treatment effect differs based on pre-experiment values (e.g., treatment helps low spenders more than high spenders), CUPED changes the interpretation of your treatment effect. It becomes an average effect holding pre-experiment levels constant, which may not be what you want.
Advanced: Multiple Covariates
CUPED extends to multiple covariates through regression adjustment:
from sklearn.linear_model import LinearRegression

def cuped_multiple_covariates(Y, X_matrix):
    """
    CUPED with multiple pre-experiment covariates.

    Args:
        Y: Outcome metric
        X_matrix: Matrix of pre-experiment covariates (n_users x n_covariates)

    Returns:
        Adjusted outcomes (residuals from regression)
    """
    # Fit regression of Y on X
    model = LinearRegression()
    model.fit(X_matrix, Y)

    # Residuals are the adjusted outcomes
    Y_adjusted = Y - model.predict(X_matrix) + np.mean(Y)

    return Y_adjusted
Covariate Selection
More covariates aren't always better. Each additional covariate:
- Adds estimation noise for its coefficient
- Requires complete data for that user
- May introduce multicollinearity
Start with the single best covariate (usually pre-experiment value of the outcome metric). Add others only if they substantially improve R².
CUPED vs. Other Methods
CUPED vs. ANCOVA
ANCOVA (Analysis of Covariance) models the outcome as a function of treatment and covariates. For A/B tests, CUPED and ANCOVA are mathematically equivalent when:
- You have one covariate
- You use the pooled theta estimate
- You don't interact treatment with the covariate
CUPED is simpler to implement and explain.
CUPED vs. Stratified Randomization
Stratified randomization ensures balance on covariates by design. CUPED adjusts for imbalance after the fact.
Both help. Stratification prevents large imbalances; CUPED reduces residual variance. You can use both together.
CUPED vs. Difference-in-Differences
DiD compares (treatment_after - treatment_before) vs (control_after - control_before). This is related but distinct:
- DiD removes unit-specific fixed effects
- CUPED optimally weights the pre-period adjustment
For A/B tests with independent users per period, CUPED is typically more efficient.
Diagnostic Checklist
Before applying CUPED:
- Covariate is pre-treatment: Measured before assignment, unaffected by treatment
- Correlation is sufficient: at minimum, ideally > 0.5
- Data completeness: <10% missing covariate values, or explicit handling strategy
- Covariate quality: No systematic measurement issues
- No interaction concerns: Treatment effect doesn't systematically differ by covariate levels
After applying CUPED:
- Verify variance reduction: Compare standard errors with and without CUPED
- Check balance: CUPED-adjusted outcomes should still be balanced at baseline
- Sanity check effect: Effect direction and magnitude should be reasonable
Related Methods
- A/B Testing Statistical Methods for Product Teams — Complete guide to A/B testing
- MDE and Sample Size: A Practical Guide — How CUPED changes your required sample
- Controlling Covariates: ANCOVA vs Regression — Related covariate adjustment methods
Frequently Asked Questions
Q: What correlation do I need for CUPED to be worth it? A: for meaningful gains (25%+ variance reduction). provides modest benefit. Below 0.3, complexity usually isn't worth it.
Q: Can I use CUPED with binary outcomes? A: Yes, but the benefits are smaller. Pre-experiment conversion rates often correlate weakly with during-experiment conversion (user either converts or doesn't). Visit frequency or engagement metrics often work better as covariates.
Q: Should theta be calculated separately per group or pooled? A: Pooled is standard and simpler. Separate-group theta is theoretically slightly more efficient but adds complexity and can be unstable with imbalanced groups.
Q: What pre-experiment period should I use? A: Match the experiment duration. If your test runs 2 weeks, use 2 weeks pre-experiment. Too short = noisy covariate. Too long = may include seasonality or changes.
Q: Can CUPED make things worse? A: If the covariate is post-treatment, noisy, or weakly correlated, yes. Always compare CUPED vs. raw standard errors to verify improvement.
Key Takeaway
CUPED is one of the highest-leverage tools for experiment sensitivity—when you have good covariates. The key requirement is "pre-experiment": the covariate must be fixed before treatment assignment. When this holds and correlation is strong (), CUPED can cut your required sample size in half. Always verify the variance reduction empirically and watch for the failure modes that make CUPED backfire.
References
- https://www.exp-platform.com/Documents/2013-02-CUPED-ImpsensitivityOnlineExp.pdf
- https://arxiv.org/abs/2106.07263
- Deng, A., Xu, Y., Kohavi, R., & Walker, T. (2013). Improving the Sensitivity of Online Controlled Experiments by Utilizing Pre-Experiment Data. *WSDM '13*.
- Poyarkov, A., Drutsa, A., Khalyavin, A., Gusev, G., & Serdyukov, P. (2016). Boosted Decision Tree Regression Adjustment for Variance Reduction in Online Controlled Experiments. *KDD '16*.
- Xie, H., & Aurisset, J. (2016). Improving the Sensitivity of Online Controlled Experiments: Case Studies at Netflix. *KDD '16*.
Frequently Asked Questions
What correlation do I need for CUPED to help?
Can CUPED introduce bias?
Should I always use CUPED?
Key Takeaway
CUPED is one of the highest-leverage tools for experiment sensitivity—when you have good covariates. The key is 'pre-experiment': the covariate must be fixed before treatment assignment. When this holds and correlation is strong, CUPED can cut your required sample size in half.