Contents
Partial Correlation
Partial Correlation is used to examine the relationship between two continuous variables while accounting for the effects of one or more other variables.

The StatsTest Flow: Relationship >> Two Continuous >> No Covariates
Not sure this is the right statistical method? Use the Choose Your StatsTest workflow to select the right method.
What is Partial Correlation?
Partial Correlation is used to understand the strength of the relationship between two variables while accounting for the effects of one or more other variables. Your variables of interest should be continuous, be normally distributed, be linearly related, and be outlier free. In addition, your variables should have a similar spread across their individual ranges. See more below.
Partial Correlation is also called conditional correlation.
Assumptions for Partial Correlation
Every statistical method has assumptions. Assumptions mean that your data must satisfy certain properties in order for statistical method results to be accurate.
The assumptions for Pearson Correlation include:
- Continuous
- Normally Distributed
- Linearity
- No Outliers
- Similar Spread Across Range
- Covariate(s)
Let's dive in to each one of these separately.
Continuous
The variable that you care about must be continuous. Continuous means that the variable can take on any reasonable value.
Some good examples of continuous variables include age, weight, height, test scores, survey scores, yearly salary, etc.
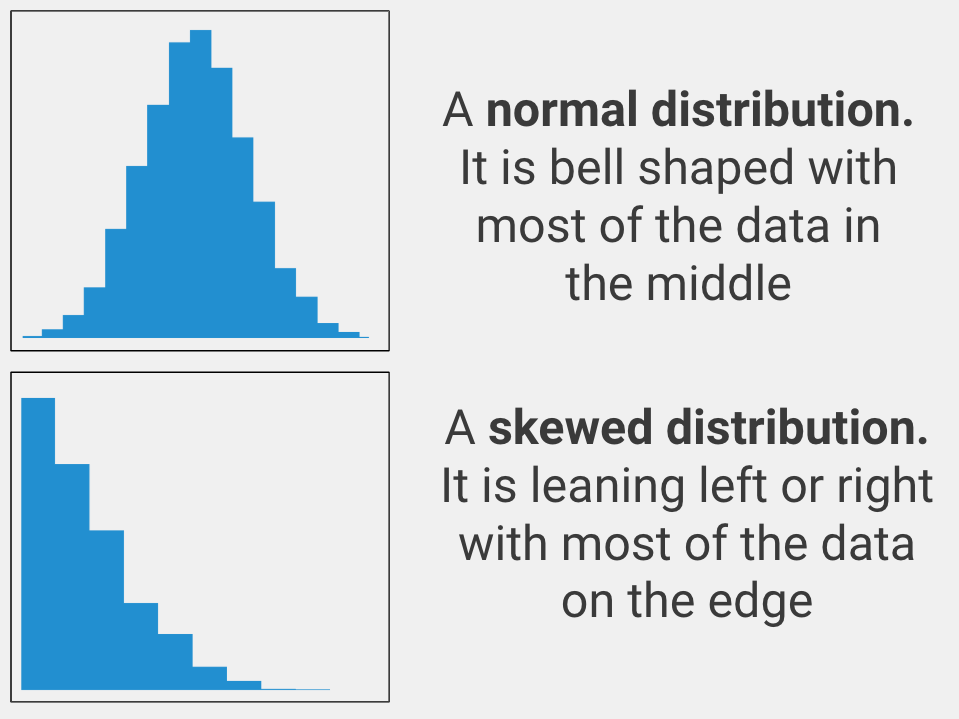
Normally Distributed
The variable that you care about must be spread out in a normal way. In statistics, this is called being normally distributed (aka it must look like a bell curve when you graph the data). Only use an independent samples t-test with your data if the variable you care about is normally distributed.
Linearity
The variables that you care about must be related linearly. This means that if you plot the variables, you will be able to draw a straight line that fits the shape of the data.
No Outliers
The variables that you care about must not contain outliers. Pearson's correlation is sensitive to outliers, or data points that have unusually large or small values. You can tell if your variables have outliers by plotting them and observing if any points are far from all other points.
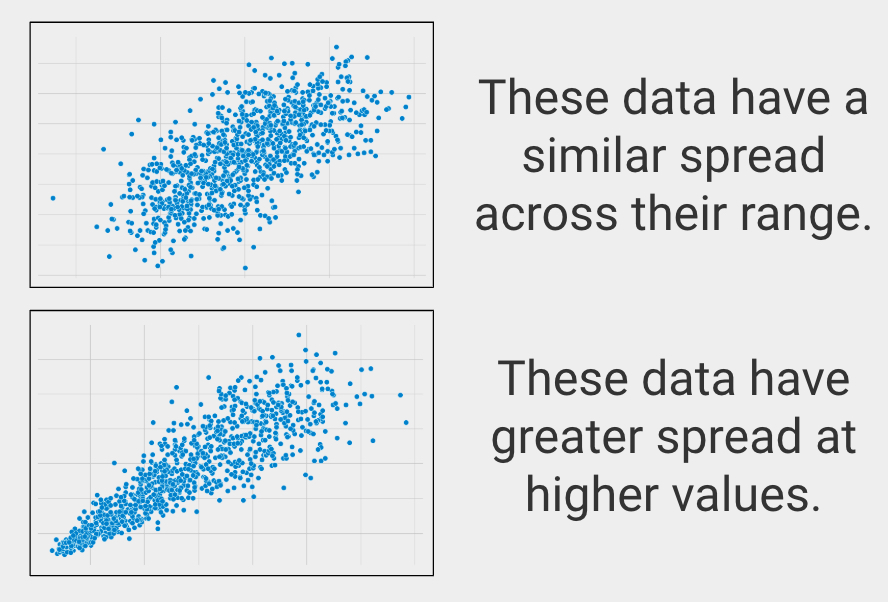
Similar Spread Across Range
In statistics this is called homoscedasticity, or making sure the variables have a similar spread across their ranges.
Covariate(s)
You should only perform partial correlation if you have one or more covariates. A covariate is a variable whose effects you want to remove when examining the variable relationship of interest. For instance, if you’re examining the relationship between age and memory performance, you may be interested in removing the effects of education level. This way, you can be sure that education level isn’t influencing the results.
If you have no covariates to include, you should use Pearson Correlation instead.
When to use Partial Correlation?
You should use Partial Correlation in the following scenario:
- You want to know the relationship between two variables
- Your variables of interest are continuous
- You have covariates
Let's clarify these to help you know when to use Partial Correlation
Relationship
You are looking for a statistical test to look at how two variables are related. Other types of analyses include testing for a difference between two variables or predicting one variable using another variable (prediction).
Continuous Data
Your variable of interest must be continuous. Continuous means that your variable of interest can basically take on any value, such as heart rate, height, weight, number of ice cream bars you can eat in 1 minute, etc.
Types of data that are NOT continuous include ordered data (such as finishing place in a race, best business rankings, etc.), categorical data (gender, eye color, race, etc.), or binary data (purchased the product or not, has the disease or not, etc.).
Two Groups
Pearson Correlation can only be used to compare two groups on your variable of interest.
If you have three or more groups, you should use or instead.
Covariates
A covariate is a variable whose effects you want to remove from the relationship you're investigating. For instance, if you're examining the relationship between IQ and chess skill, you may be interested in removing the influence of amount of chess training. This way, you can isolate the relationship you're interested in. Partial correlation is designed to include one or more covariates.
If you do not have one or more covariates, you should use Pearson Correlation instead.
Partial Correlation Example
Variable 1: Height
Variable 2: Weight
Covariate: Age
In this example, we are interested in the relationship between height and weight while accounting for the effect of age. So to begin, we collect height, weight, and age from a group of people.
First, we check that our variables of interest meet the assumptions of Partial Correlation. After confirming that height and weight are normally distributed, have no outliers, have a similar spread across their range, and are linearly related (see above for details), we move forward with the analysis.
The analysis will result in a correlation coefficient (called "r") and a p-value. R values range from -1 to 1. A negative value of r indicates that the variables are inversely related (i.e. when one variable increases, the other decreases). On the other hand, positive values indicate that when one variable increases, so does the other.
The p-value represents the chance of seeing our results if there was no actual relationship between height and weight while controlling for the effects of age. A -value means that our result is statistically significant and we can trust that the difference is not due to chance alone.