Contents
Kolmogorov-Smirnov Test: Comparing Distributions and Detecting Drift
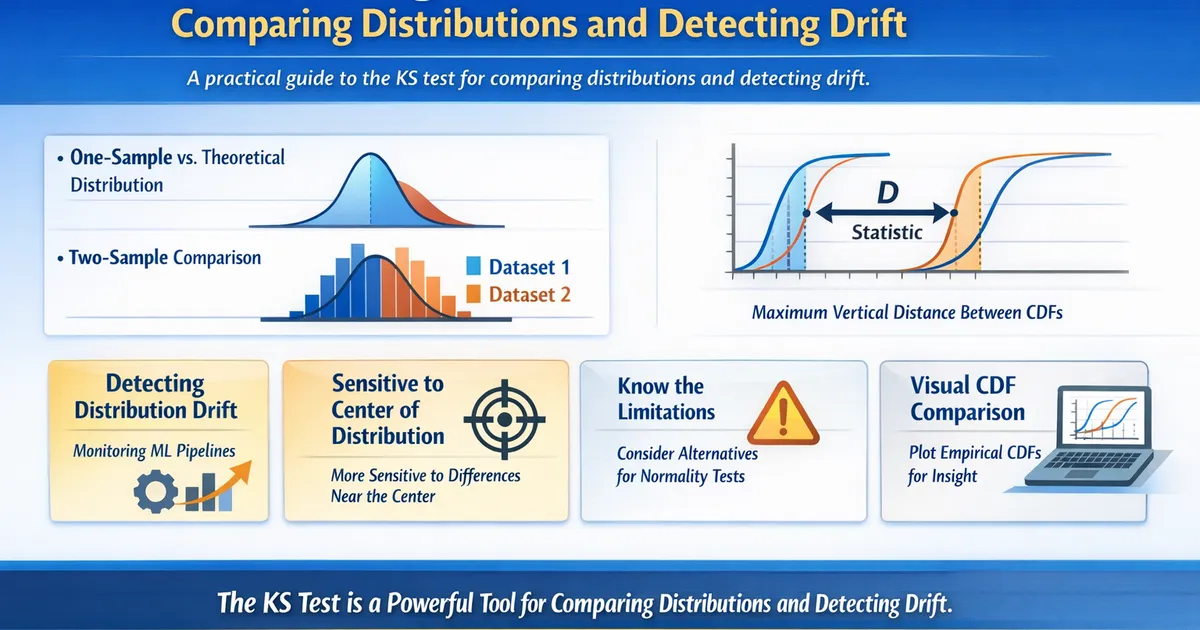
A practical guide to the KS test for comparing distributions and detecting drift. Learn the one-sample and two-sample variants, common pitfalls, and when to use alternatives.
Quick Hits
- •Two variants: one-sample (vs. theoretical) and two-sample (vs. another dataset)
- •D statistic = maximum vertical distance between CDFs
- •More sensitive to differences near the center of the distribution than the tails
- •Two-sample KS is the workhorse for drift detection in ML pipelines
- •For normality testing specifically, Shapiro-Wilk is more powerful
The Kolmogorov-Smirnov Test is one of the most versatile distribution tests available. This post covers practical applications, especially for drift detection.
One-Sample vs. Two-Sample
One-sample KS test: Tests whether your data follows a specific theoretical distribution (normal, exponential, uniform, etc.). The reference distribution must be fully specified in advance — you cannot estimate parameters from the test data.
Two-sample KS test: Tests whether two empirical samples come from the same distribution. No theoretical distribution is needed. This is the more useful variant in practice.
Drift Detection in Production
The two-sample KS test is widely used to detect when the distribution of model inputs or outputs has shifted:
- Save a reference distribution from training or a baseline period
- Periodically compare new production data against the reference
- Alert when D exceeds a threshold or p-value drops below significance level
Practical tips:
- Use a sliding window (e.g., last 7 days vs. reference period)
- Set alerts on the D statistic rather than p-value (p-value is too sensitive with large production datasets)
- Combine with PSI (Population Stability Index) for a more complete picture
Limitations and Alternatives
The KS test is most sensitive near the center of the distribution and less sensitive in the tails. If tail behavior matters (e.g., for revenue metrics), consider:
- Anderson-Darling test: Gives more weight to the tails
- Cramér-von Mises test: Integrates squared differences across the entire CDF
- Chi-square test: For categorical or binned data
See also: Drift Detection: KS Test, PSI, and Interpreting Signals for a deeper treatment of drift monitoring.
References
- https://www.itl.nist.gov/div898/handbook/eda/section3/eda35g.htm
- https://arxiv.org/abs/2004.03045
Frequently Asked Questions
Can I use the KS test for discrete data?
Why shouldn't I estimate parameters from the same data I test?
How does the KS test compare to PSI for drift detection?
Key Takeaway
The KS test is the most versatile distribution comparison tool. The two-sample variant is especially valuable for detecting distribution drift in production ML systems and monitoring metric health. Pair it with visual CDF comparisons for the most insight.