Contents
Time-to-Event / Survival Analysis
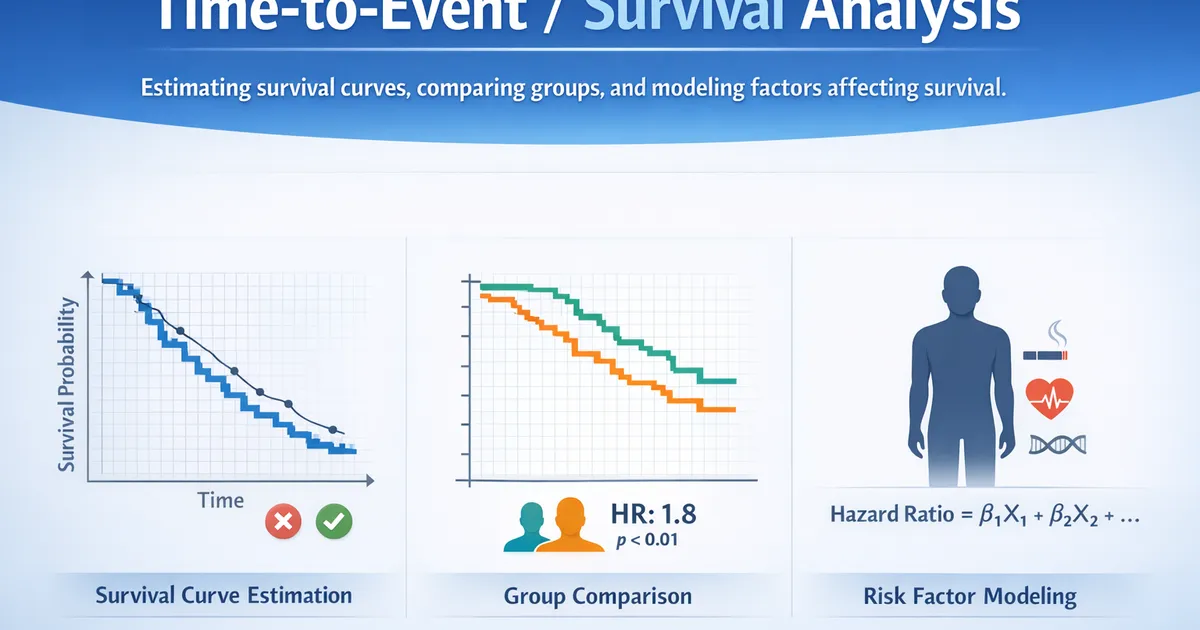
Are you trying to estimate a survival curve, compare survival between groups, or model the factors that affect survival? Choose the right approach for your time-to-event question.
What do you want to do with your time-to-event data?
Estimate a survival curve (how long until the event?)
- OR -
Compare survival between groups (do groups differ?)
- OR -
Model factors that affect survival (what drives the hazard?)
More Information (if you need help deciding)
Estimate a survival curve: Use the Kaplan-Meier Estimator when you want to visualize or describe the survival experience of a single group. For example, what is the D30 retention for users who signed up in January? The Kaplan-Meier curve shows the probability of surviving (not experiencing the event) over time and correctly handles censored observations.
Compare survival between groups: Use the Log-Rank Test when you want to know if two or more groups have different survival curves. For example, do users on the guided onboarding flow retain longer than users on the self-serve flow? The log-rank test compares the entire curves, not just a single time point.
Model factors that affect survival: Use Cox Proportional Hazards Regression when you want to understand which covariates (predictors) affect the rate of the event, while controlling for other factors. For example, which user characteristics predict faster conversion from free trial to paid plan? Cox regression produces hazard ratios that quantify the effect of each predictor.